
📙 Knowledge Base Tip: Reviewing the Survey Results article before viewing or exporting survey results is recommended.
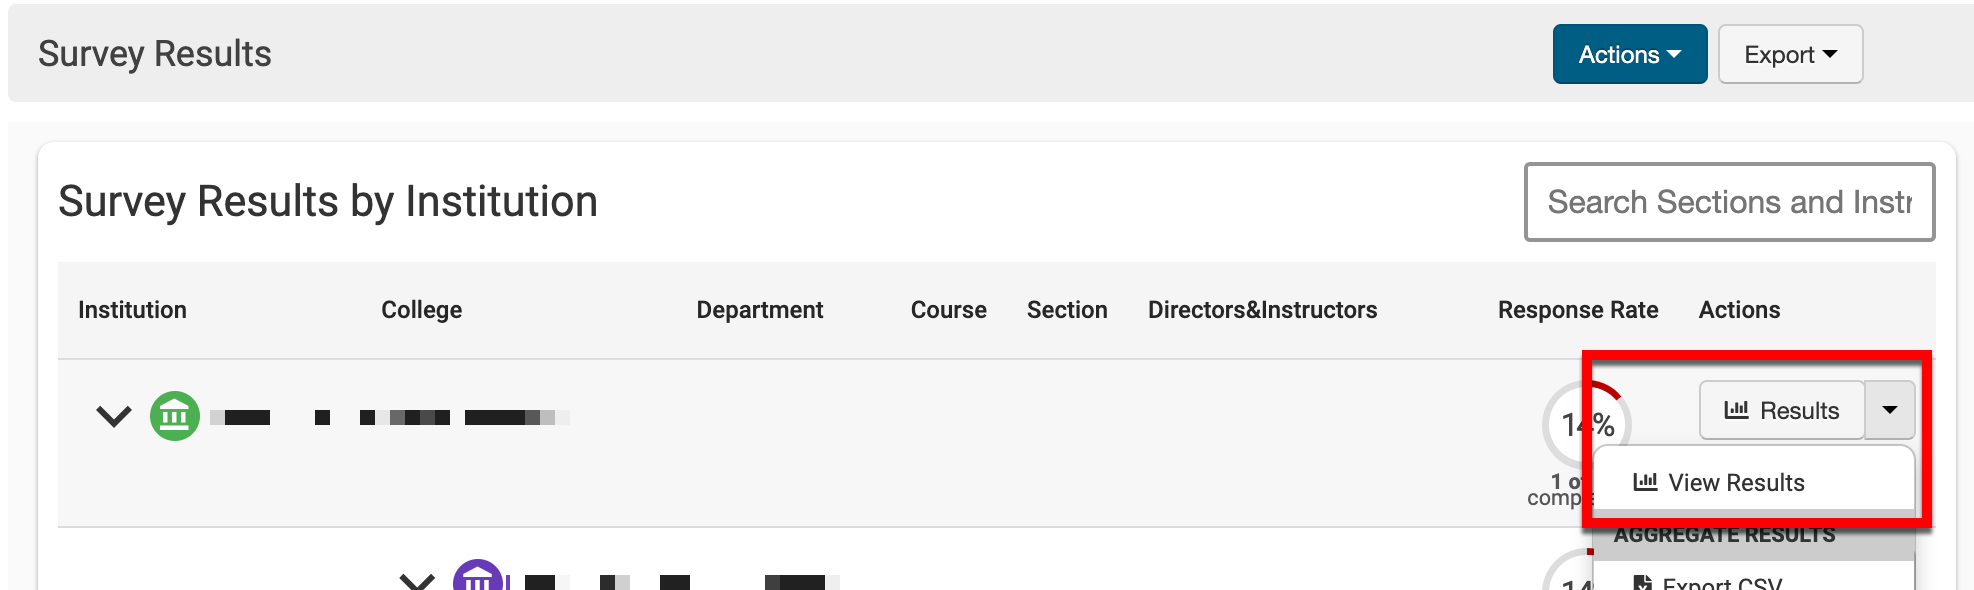
Survey results can be viewed by navigating to the Survey Results page from the left-hand menu of the Survey Homepage and clicking Results or View Results for the selected aggregate level (e.g., Institution, College, Department, Course, etc.).
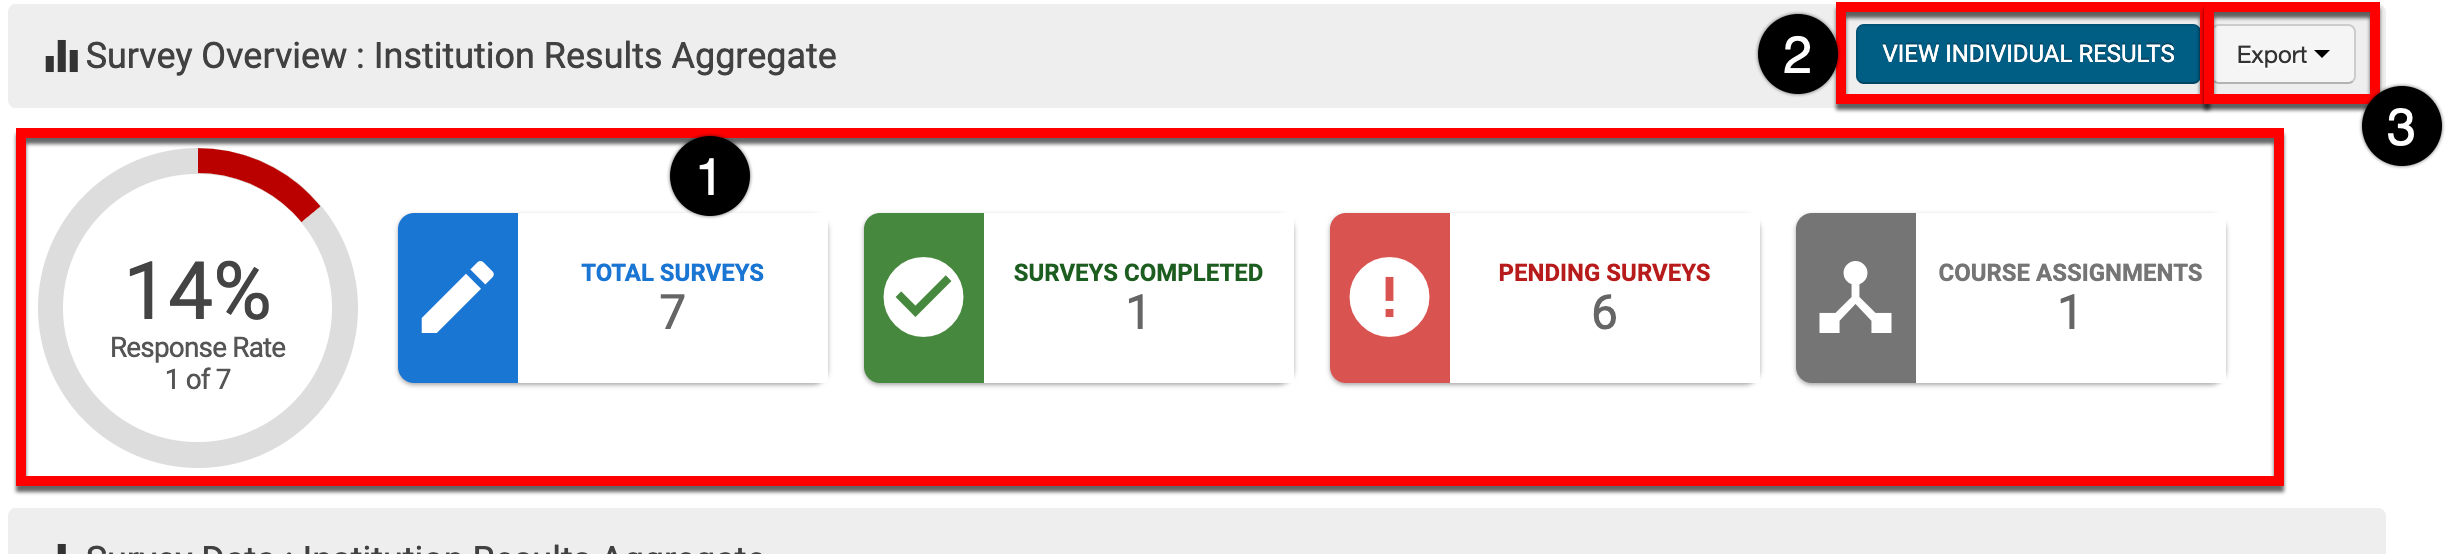
The Survey Results Aggregate page will load, displaying the aggregate survey results for the selected aggregate level. General statistics about the survey (1), such as response rate, total surveys, etc., auto-update as the survey progresses. The page view can be toggled between aggregate results and individual results by clicking View Individual Results (2); when viewing individual results, a View Aggregate Results button will be available. Depending on whether the view is configured as aggregate or individual, various export options are available (3).
Exporting Aggregate Results
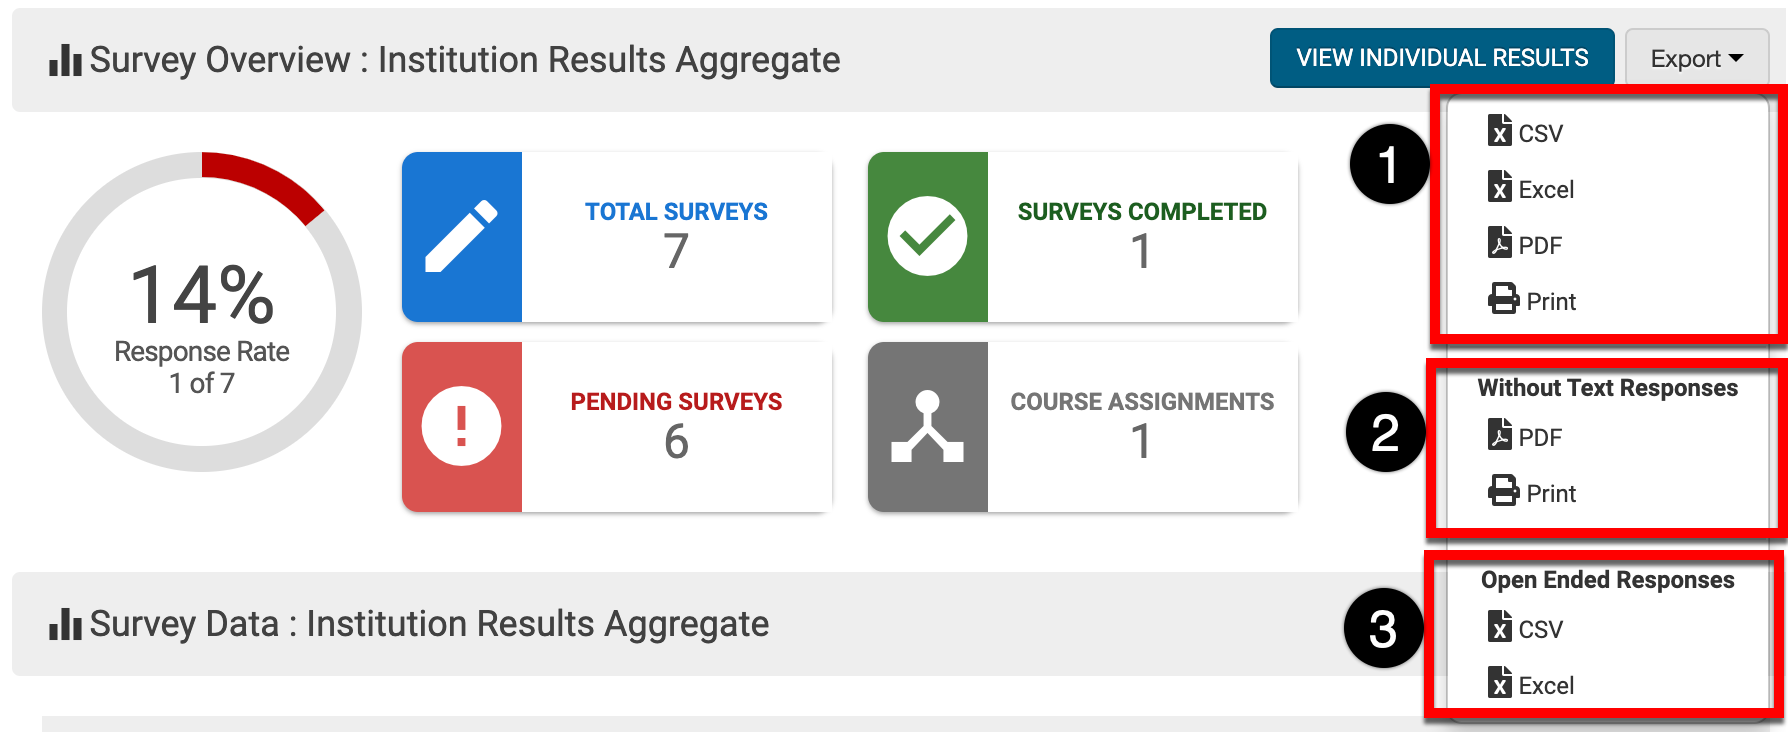
Standard options (1) can be used to export all aggregate results to CSV, Excel, PDF format, or print. Additional more customizable exports can also be utilized:
-
Without Text Responses (2): Exports aggregate results to PDF format or print and excludes all responses to any text/memo question types included on the survey form. The export will only contain aggregate results for all multiple-choice question types.
-
Open Ended Responses (3): Exports aggregate results to PDF format or print and excludes all responses to any multiple-choice question types. This export option will generate a document containing all aggregate results for all text/memo question types.
Exporting Individual Results
|
CSV and Excel Exports |
|
|
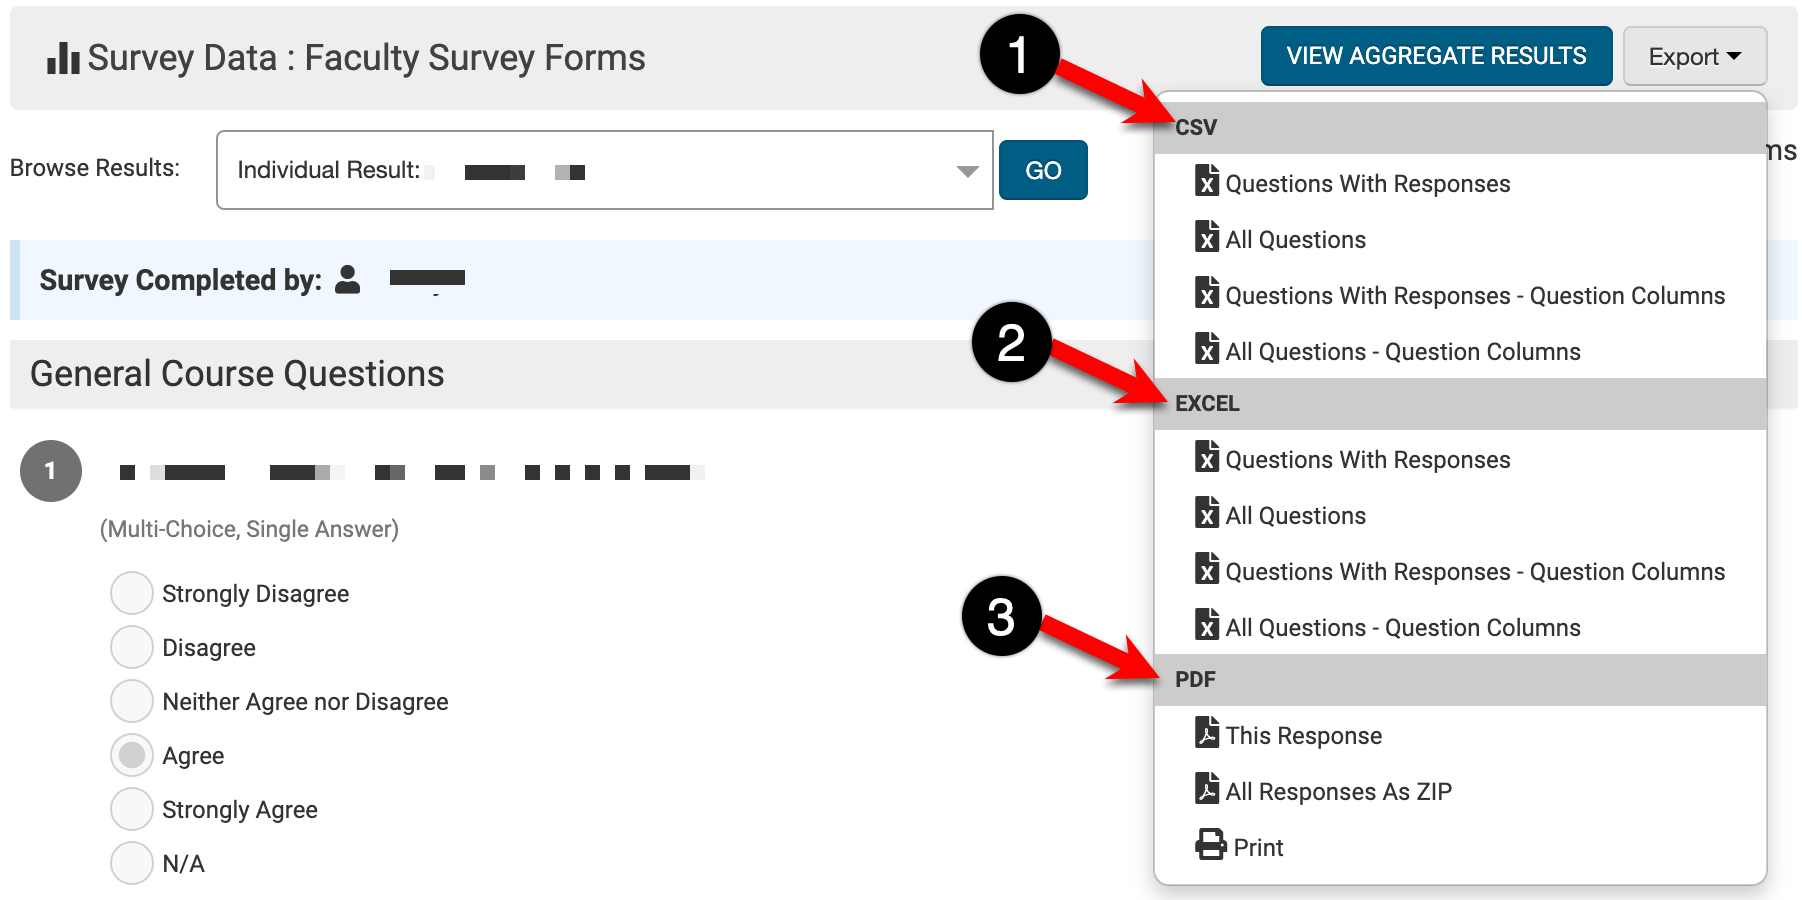
Questions With Responses |
Exports a CSV or Excel file containing all of the questions and the responses. Each question that was answered will appear in its own row; if a question was not answered, it will be excluded from the export. |
|
All Questions |
Exports a CSV or Excel file containing all of the questions and responses, including rows for questions to which the users did not respond. Each question, regardless of whether or not it was answered, will appear in its own row. |
|
Questions with Responses – Question Columns |
Exports a CSV or Excel file containing one row per respondent. If a question was not answered, it will be excluded from the export. |
|
All Questions – Question Columns |
Exports a CSV or Excel file containing one row per respondent. Each question, regardless of whether or not it was answered, will appear in its own column. |
|
PDF Exports |
|
|
This Response |
Exports a PDF of the responses by each individual respondent. The Browse Results drop-down can be used to toggle to a different respondent for export. 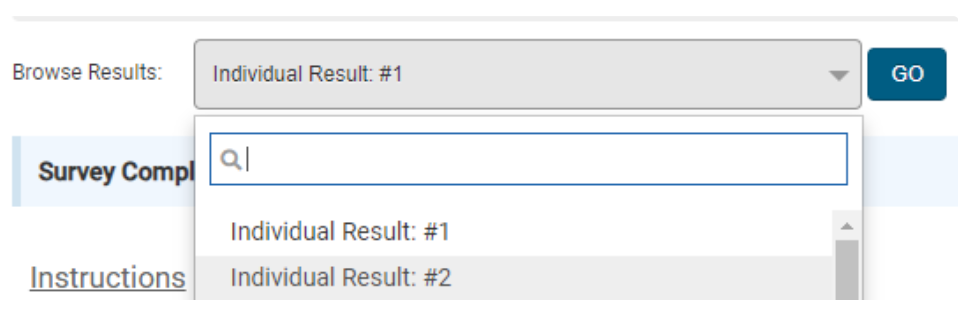
|
|
All Responses As Zip |
Generates a zip folder containing one PDF file per respondent. |
|
|
Opens the printer dialogue box to print the survey responses from the currently viewed individual result. |
Export Output Based on Question Type
Multiple-Choice Question Types
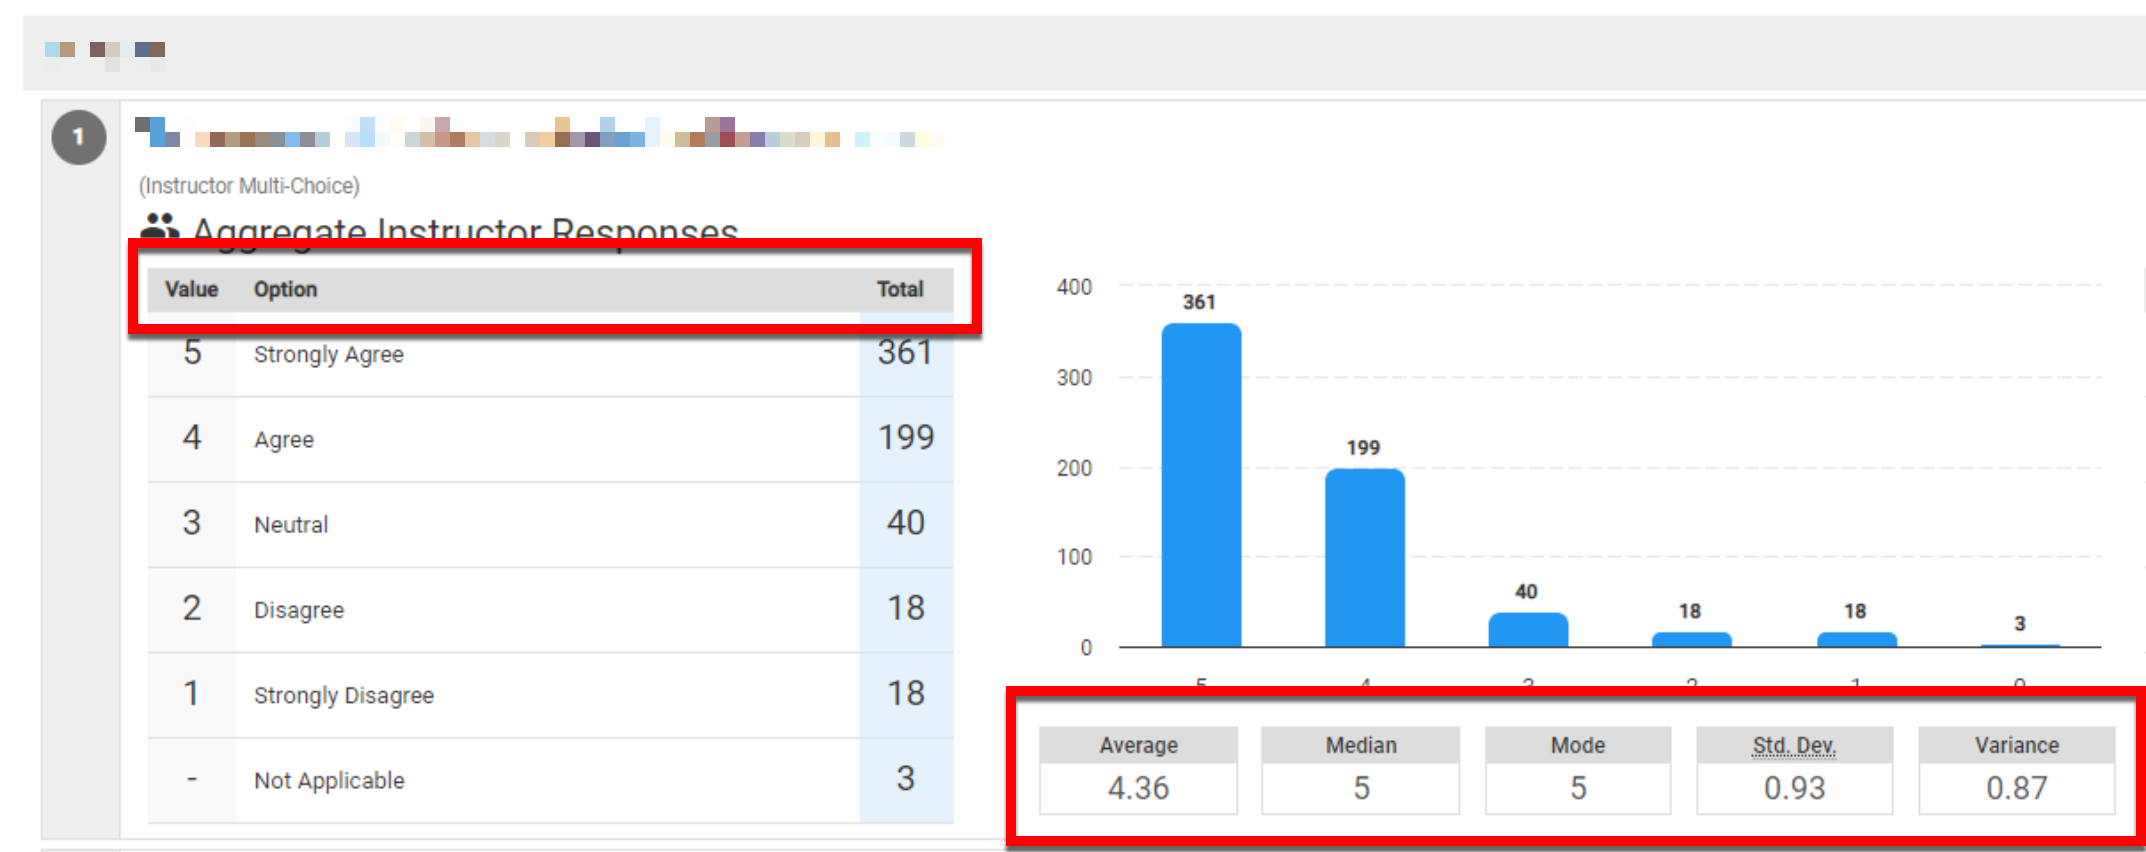
Multiple-choice questions generate an output containing the value, option, total, average, median, mode, standard deviation, and variance. For multiple-choice question types with comments enabled, comments will appear as they were input by the respondent – one comment per line – as well as a word cloud.
|
|
|---|---|
|
Value
|
The numeric value associated with the answer options. |
|
Option |
The answer options from which a survey participant could make a selection. |
|
Total |
The total number of responses for each answer option. |
|
Average |
The average score – the sum of the responses divided by the total number of responses. |
|
Median |
The median score – the value at the midpoint of the frequency distribution of responses. |
|
Mode |
The value that was most commonly selected by survey participants. |
|
Std Dev. |
Measures of the amount of variation in the response set. A low standard deviation indicates that the values tend to be close to the mean, while a high standard deviation indicates that the values are spread out over a wider range. |
|
Variance |
Variance is a statistical measurement used to determine how far each number is from the mean and from every other number in the set. |
Text/Memo Question Types
Text memo question types will produce an output with one bullet point per individual response up to 500 responses. Additionally, a word cloud will be generated, although word clouds do not contain numbers.
Product Tip
Wordcloud ignore words can be configured by navigating to Institution Homepage > Course Settings > Word Cloud Ignore Words. Learn more about Institution Survey Results and Form Settings.
|
|
|---|---|
|
Question |
Below each question, each response appears in a bulleted list. |
|
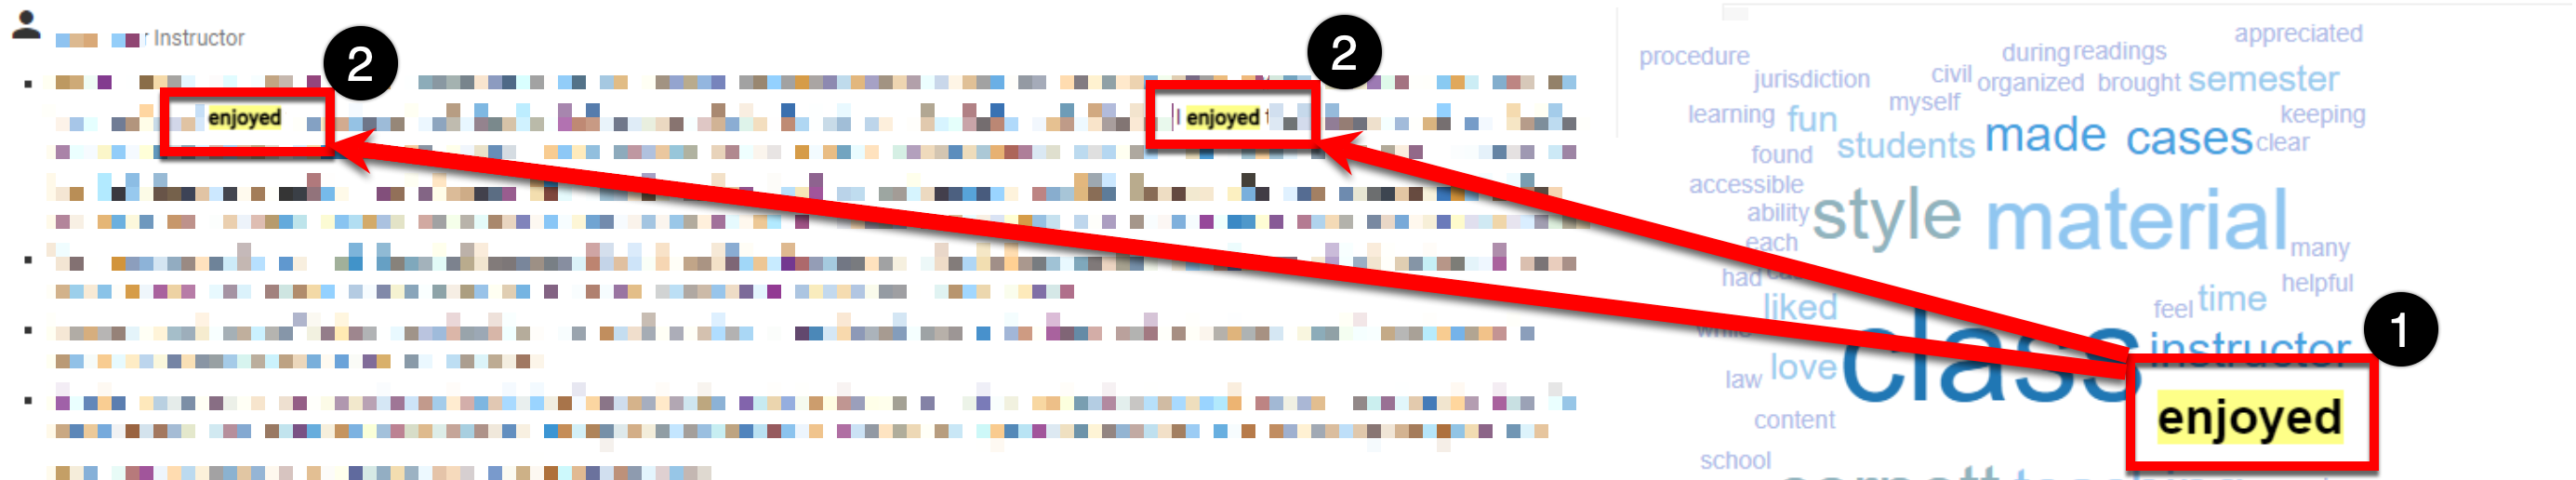
Word Cloud |
A word cloud generation – words used more frequently appear larger. Each word is clickable (1) and will highlight all the responses where that word was used (2). |