
The Curriculum Map report enables users to view and export published and in-progress curriculum maps for use in self-studies, program review, and revision. It displays a matrix showing how courses and their learning outcomes map to program-level outcomes and performance indicators, with developmental-level designations. This report belongs to the Program Management Reports category and is accessible from Analytics > Report Library > Program Management Reports > Curriculum Map.
User roles with permissions to utilize this report include:
-
College Admin
-
Department Admin
-
Institution Admin
-
Program Coordinator
Use Cases
|
Prepare Curriculum Maps for Accreditation Self Studies |
|
Programs undergoing accreditation review may need to document how their curriculum maps course learning outcomes to program outcomes and performance indicators. This report produces an exportable matrix showing developmental levels for each mapping, suitable for inclusion in self-study documents. |
|
Identify Gaps In Curriculum-to-Outcome Coverage |
|
During program review, faculty committees could verify that all program outcomes are adequately addressed across the curriculum. By selecting Only Not Mapped as the mapping type, the report highlights courses and outcomes that lack mappings, enabling targeted curriculum revision. |
|
Compare Curriculum Maps Across Program Versions |
|
When programs undergo revision, assessment coordinators need to compare how outcome mappings have changed between versions. By selecting different program versions, this report produces the mapping matrix for each version for comparison. |
|
Generate Curriculum Maps At Different Outcome Levels |
|
Programs may need to view their curriculum map at the program outcome level, the institutional outcome level, or both. The Outcome Level(s) To Include parameter allows filtering to the relevant outcome space(s) for the intended audience. |
Considerations
-
Program Version Selection Matters: The report requires selecting a specific program version. Published and in-progress versions may have different outcome mappings. Select the version appropriate for the review purpose.
-
The Mapping Type Parameter Controls What Cells Appear: "Both" shows all course-outcome intersections regardless of mapping status. "Only Mapped" shows only cells where a developmental level has been assigned. "Only Not Mapped" shows only cells without mappings, useful for gap analysis.
-
Report Layout Affects The Matrix Orientation: "Courses" (default) places courses as rows and outcomes/performance indicators as columns. "Outcomes" reverses this orientation. Choose the layout that best fits the review needs and the number of courses versus outcomes.
-
Educational Experience Category Is Optional But Useful For Large Programs: For programs with many courses organized into categories (e.g., Core, Elective, Capstone), filtering by category can produce more focused and readable curriculum maps.
Best Practices
-
Use the "Courses as Rows" layout when the program has more outcomes than courses, and "Outcomes as Rows" when the reverse is true, to produce the most readable matrix.
-
Export to CSV or Excel for programs with very large curriculum maps that may be difficult to read on screen.
-
Run the report with the Mapping Type parameter as "Only Not Mapped" to produce a gap analysis, then switch to "Only Mapped" for the accreditation-ready version.
-
Filter by specific educational experience categories to produce focused maps for different sections of a self-study.
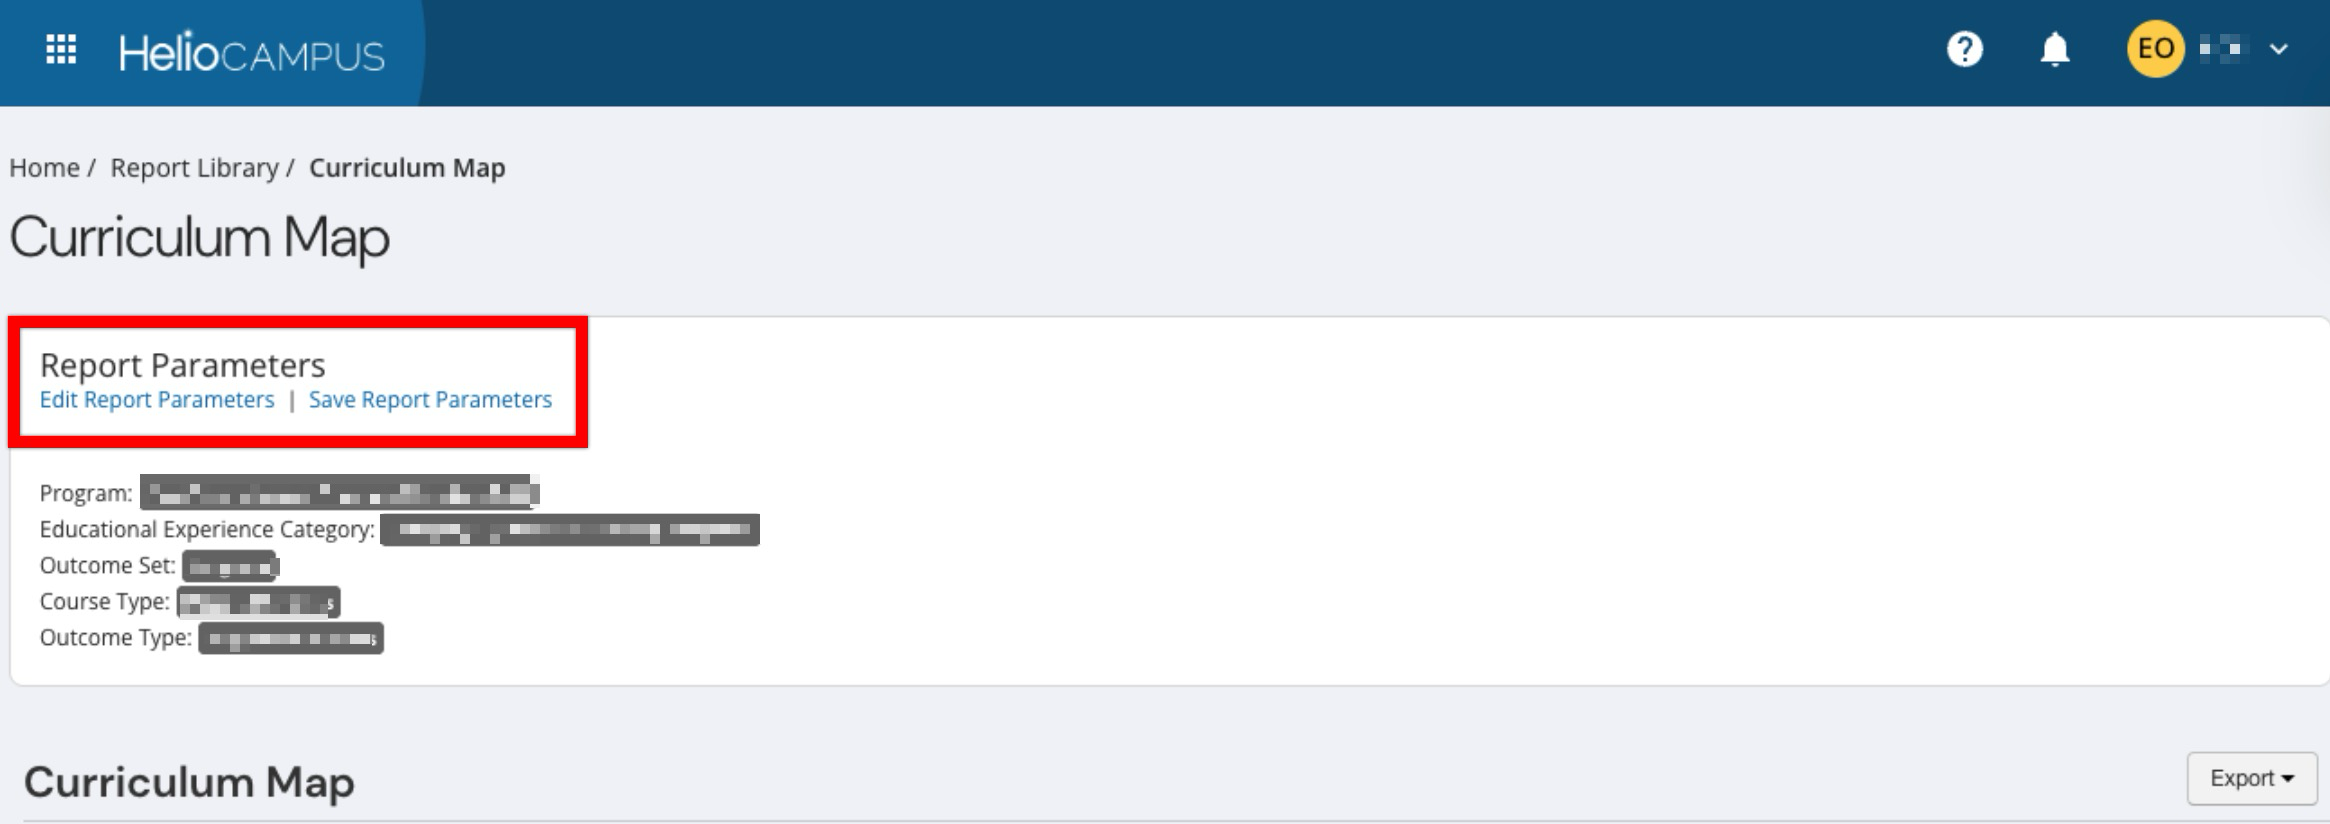
Report Parameters
|
Parameter |
Required |
Description & Visibility Limitations |
|---|---|---|
|
Parameters are listed in alphabetical order |
||
|
College / Administrative Division |
Required |
Filters by college or administrative division. Selecting a college automatically filters the Department / Administrative Unit and Program parameters. |
|
Department / Administrative Unit |
Required |
Filters by department or administrative unit. Filtered by the selected College value. Selecting a department automatically filters the Program parameter. |
|
Educational Experience Category |
Optional |
Filters by the educational experience category within the selected program version (e.g., Core, Elective, Capstone). Filtered by the selected Program Version parameter. Multiple selections allowed. |
|
Mapping Type |
Optional |
Controls which course-outcome intersections are displayed.
|
|
Outcome Level(s) to include |
Optional |
Filters by the outcome space(s) to include in the map (e.g., Program Outcomes, Institutional Outcomes, Accreditor Outcomes). Multiple selections allowed. |
|
Program |
Required |
Filters to a specific published program. Filtered by the selected College and Department parameter values. Only published programs are available. Selecting a program automatically updates the Program Version parameter. |
|
Program Version |
Required |
Selects the specific version of the program to map. Filtered by the selected Program. Selecting a version automatically updates the Educational Experience Category parameter. |
|
Report Layout |
Optional |
Controls the orientation of the curriculum map matrix.
|
Report Output
Once report parameters have been configured and Run Report has been clicked, the report output will display below the collapsed read-only view of the report parameters. Clicking Edit Report Parameters will reopen edit capabilities; once parameters have been edited, Run Report can be clicked again to re-generate the report output. Clicking Save Report Parameters will open the Create a New Saved Report pop-up, where the name and description of the new saved report can be entered. Once a report has been saved, it will be available via the My Saved Reports tab of the Report Library.
The report output is a crosstab (matrix) showing the relationship between courses and outcomes. By default, the report output is generated with courses as rows unless the Report Layout parameter is configured as Outcomes. If "No Data Returned" is displayed, verify that:
-
The selected program version includes courses with defined CLOs.
-
Outcome mappings exist for the selected program (check the Mapping Type parameter).
-
The selected outcome level(s) have outcomes defined and mapped.
The report output is grouped by course (course code and name), then by CLO code and CLO description within each course (1). Each column (2) represents an outcome/performance indicator displayed as the performance indicator code and name. Each cell (3) displays the level name (e.g., Introduced, Reinforced, Mastered) assigned to the mapping between that course's CLO and the outcome/performance indicator; empty cells indicate no mapping exists. The report output can be exported (4) to PDF, Excel, CSV formats, or printed. Selecting Save Report as PDF will display a PDF export in the My Document Requests dashboard widget once the request is processed.
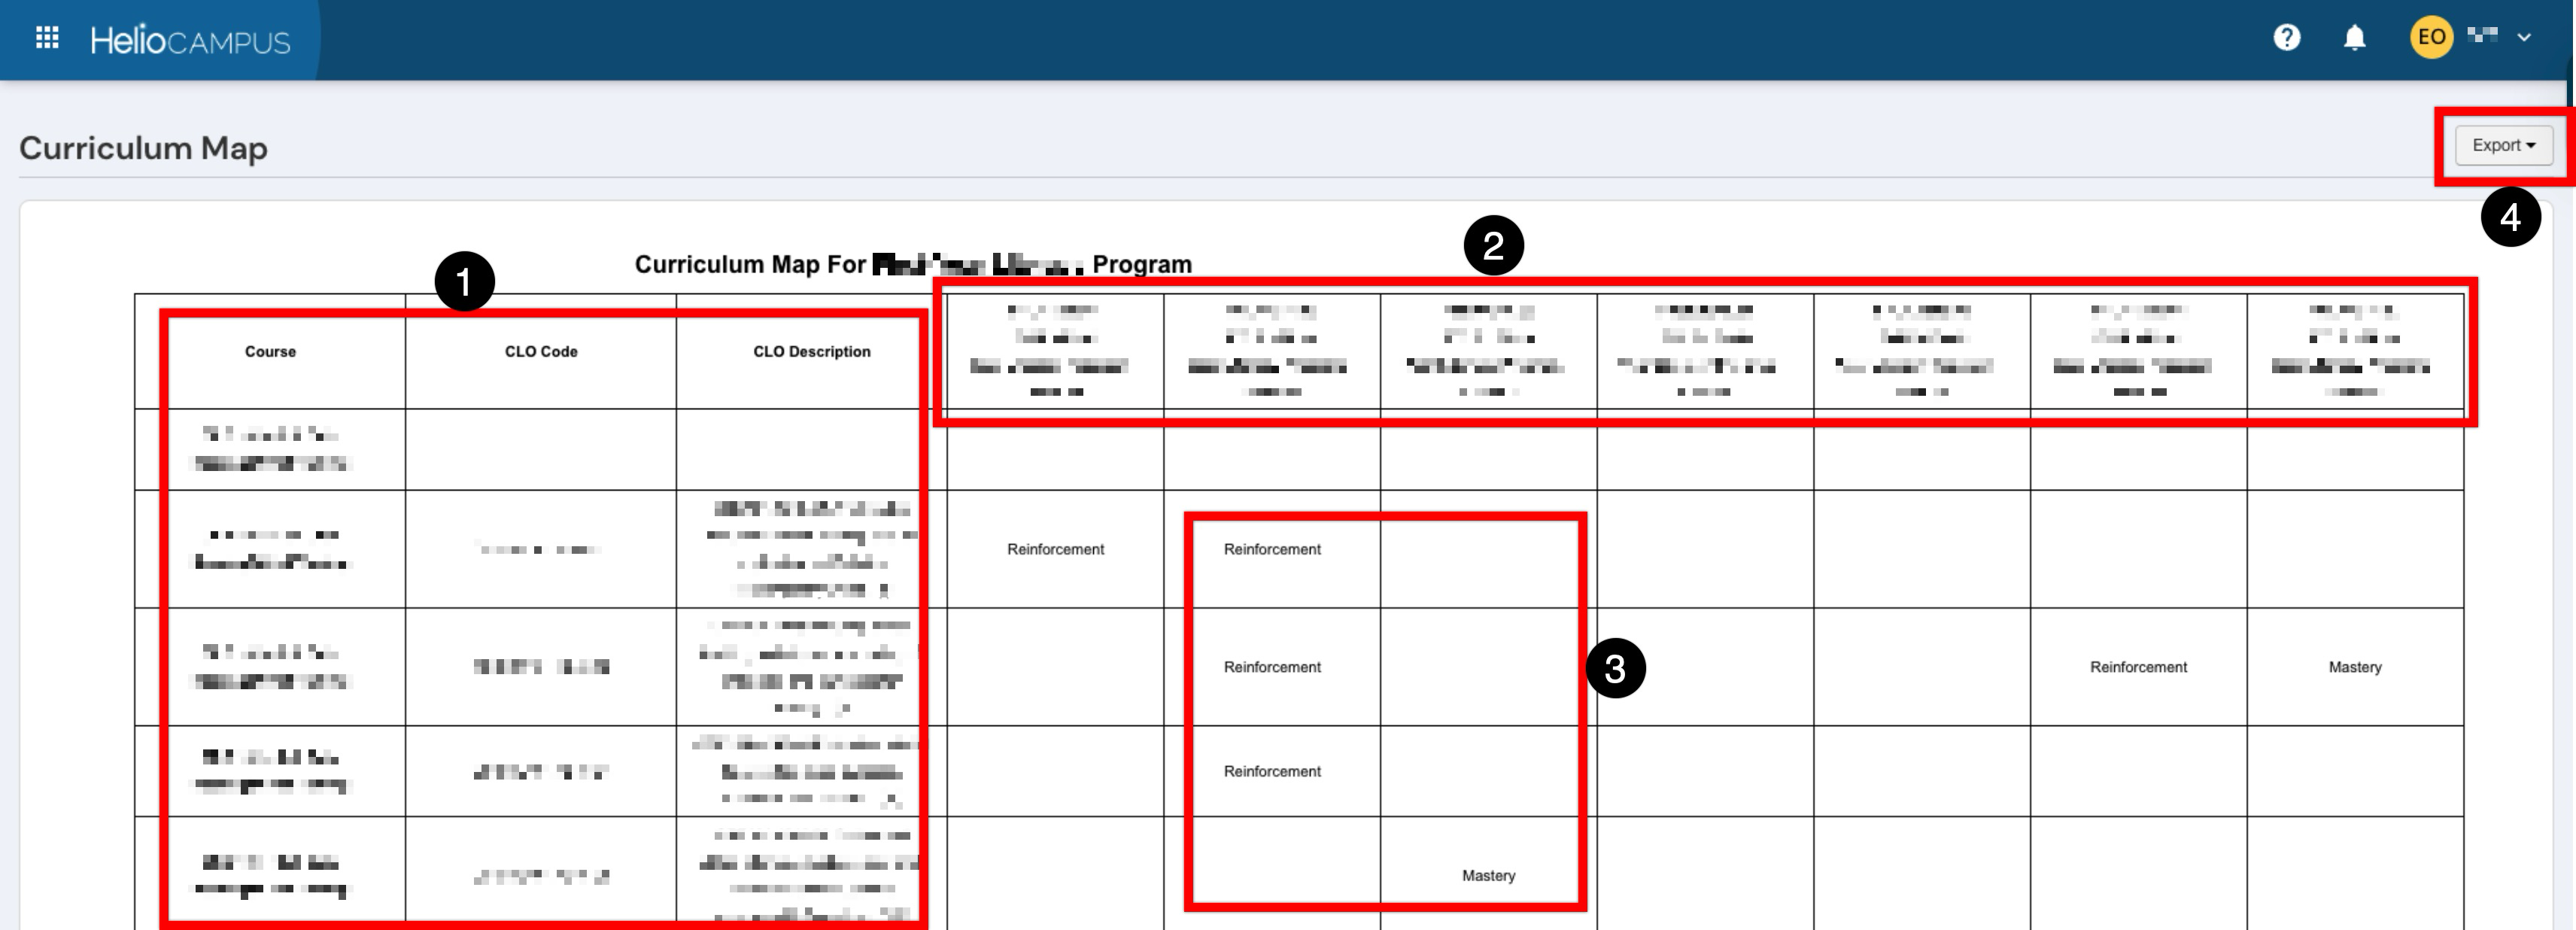
When the Report Layout parameter is configured as Outcomes, the matrix is transposed, and outcomes and performance indicators appear as rows, with courses as columns. Cell values remain the same (developmental level names). When exported to CSV or Excel, the crosstab is flattened into a tabular format with columns for course code, course name, CLO code, CLO description, outcome/indicator code, outcome/indicator name, and developmental level name and value.
Frequently Asked Questions
Related Reports
|
Report |
Description |
|---|---|
|
Program Outcome |
Shows program outcome mappings and their relationships to other outcome sets (Institution, College, Department, Accreditor). |
|
Course Learning Outcomes Audit |
Verifies that courses have CLOs defined, which is a prerequisite for meaningful curriculum mapping. |
|
Program Course Outcome |
Displays courses and competencies with related student learning outcomes within a program. |