
📙 Knowledge Base Tip: Before utilizing any reports, reviewing the Report Library article is recommended.
Use this report to analyze key metrics from Student Course Evaluations, aggregating data across Instructors, courses, and sections. This report focuses on metric-based questions from the survey template, showcasing aggregated results tailored to courses, sections, or Instructors. Applicable exclusively to evaluations with metric questions. User roles with permissions to utilize this report include:
-
College Admin
-
College Survey Admin
-
Course Coordinator
-
Course Section Director
-
Department Admin
-
Department Survey Admin
-
Institution Admin
-
Institution Survey Admin
-
Instructor
-
Preceptor
-
Teaching Assistant
Product Tip
Users with Organizational Hierarchy roles (e.g., Institutions Admin, College Admin, etc.) will only see the business objects (colleges, departments, courses, etc.) they are associated with. For example, College Admins can configure report parameters and view report results only for the course sections associated with the colleges for which they are assigned the admin role.
Use Cases
|
Inform Curriculum Changes & Enhance Student Experience |
|
The aggregated data assists in making informed decisions about course content and structure. If the report shows that students across multiple sections find specific topics less relevant or too challenging, the curriculum could be adjusted to meet student needs better. Institutions can create a more positive learning environment by continuously analyzing and responding to student feedback. |
|
Identify Strengths and Weaknesses |
|
By aggregating data across different courses, course sections, and Instructors, Institutions can identify trends in student feedback. For instance, if several sections of a course consistently receive lower ratings on "course organization," this might indicate a need for curriculum restructuring or additional Instructor training. |
|
Facilitate Instructor Development |
|
The report allows administrators to pinpoint specific areas where individual Instructors may need support. For example, if an Instructor's course section consistently scores lower on "clarity of instruction" than other sections, the Institution can provide targeted professional development or mentoring. |
Considerations
-
If this report is generated to display all evaluation results over an entire term, the report generation may time out depending on the amount of requested data. In the event of a time-out or issues generating this type of output, please contact Support.
-
Instructors are associated with course sections and not specific colleges or departments in the Organizational Hierarchy. If this report is aggregated and generated at the college or department level, the report output will include all associated course sections within the college(s)/department(s). To generate this report for a specific Instructor, the College/Administrative Division and the Department/Administrative Unit parameters must both be configured to Select All, and the Instructor's type should be selected from the Instructor parameter.
-
The results are dependent on the Aggregate Level parameter selection. If the selection is a higher level, such as a college or department, selecting a specific instructor or course section will not affect the report output. For example, when aggregating at the department level with three course sections selected, the report output will only display the overall department results.
Parameters
|
Parameter |
Details |
|---|---|
|
Aggregate Level |
Optional. Choose the Organizational Hierarchy, subject, course, or course section level at which to aggregate the report output. The Subject level is useful when disaggregating higher-level data. For example, disaggregating college or department-level data to the individual subject-level aggregates rather than configuring the Course parameter to Select All for the specific subject code. |
|
Term |
Required. Multiple terms can be selected to compare the results of sections across terms. |
|
Optional. The adaptive search will auto-update search results as they are typed. Multi-select, select-all, and deselect all functionality is available. |
|
Instructor Type |
Optional. This parameter is useful for narrowing results and making the configuration of the Instructor parameter easier. |
|
One is required. One or more courses and/or one or more Instructors are required to be selected to configure the Course Sections parameter. |
|
Course Section |
Required. Multiple course sections across multiple terms can be selected. |
|
Additional Parameters |
|
|
Optional. When Completed Surveys Only is enabled, completed surveys will be included in the report output. |
Report Output
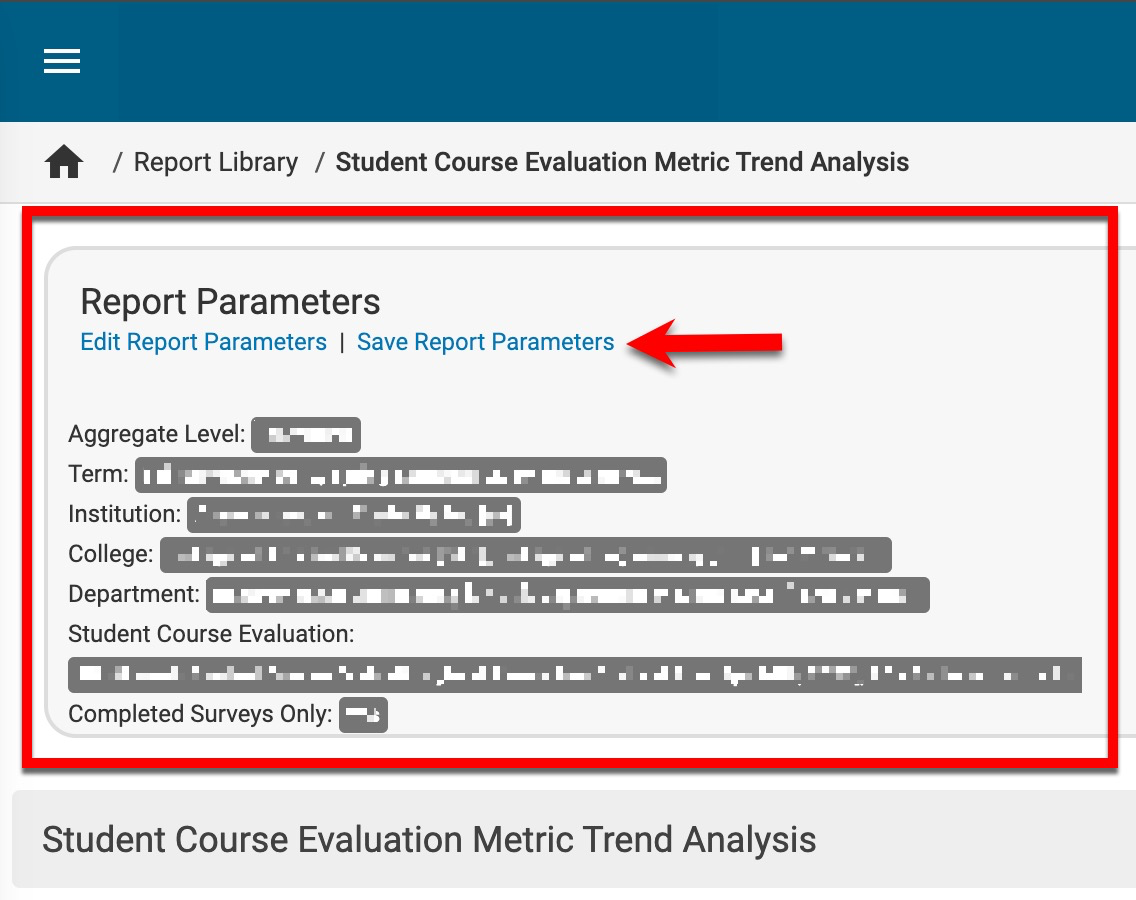
Once report parameters have been configured and Run Report has been clicked, the report output will display below the collapsed read-only view of the report parameters. Clicking Edit Report Parameters will reopen edit capabilities; once parameters have been edited, Run Report can be clicked again to re-generate the report output. Clicking Save Report Parameters will open the Create a New Saved Report pop-up, where the name and description of the new saved report can entered. Once a report has been saved, it will be available via the My Saved Reports tab of the Report Library.
|
|
|---|---|
|
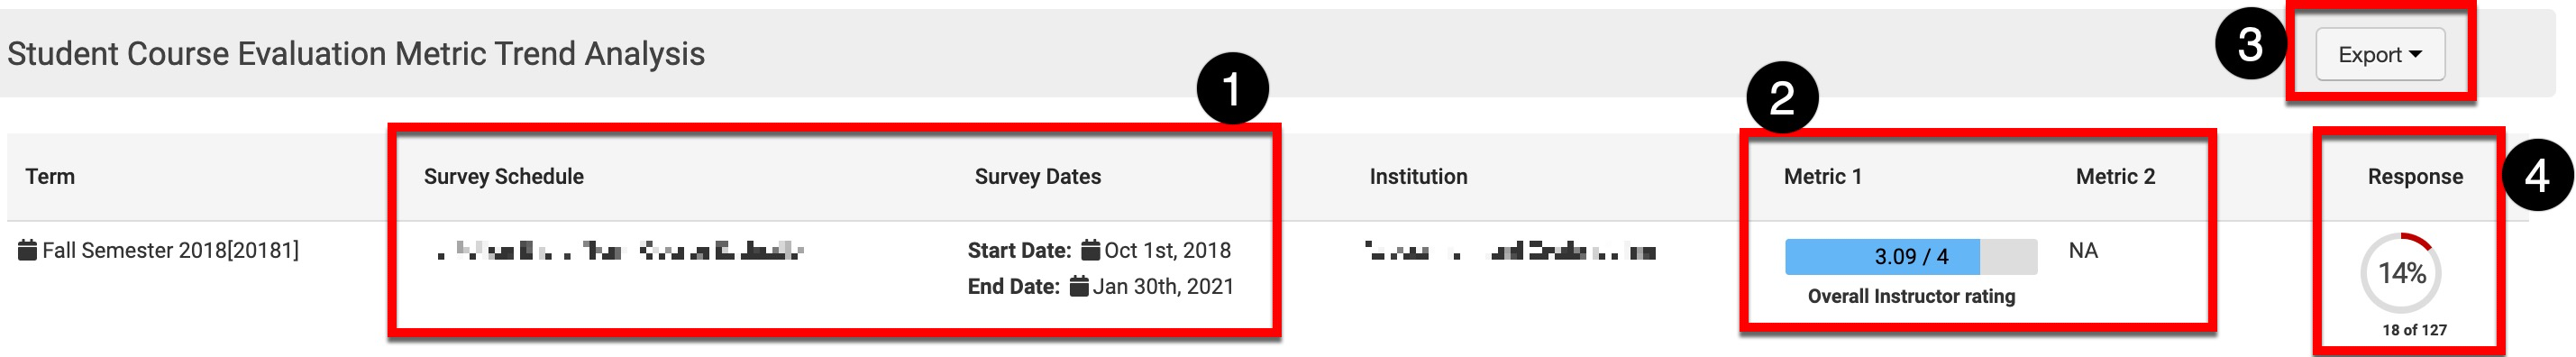
1 |
Survey schedule name and start/end date. |
|
2 |
Survey metrics will display as applicable. Learn more about survey template metrics. |
|
3 |
The report output can be exported to PDF, Excel, CSV formats, or printed. |
|
4 |
This at-a-glance response rate displays the total number of completed forms based on the percentage of responses compared to the number of participants who received the survey. 💡 Product Tip: This same response rate is displayed on the Survey Results page. Learn more about Survey Results. |