
|
|
|---|---|
|
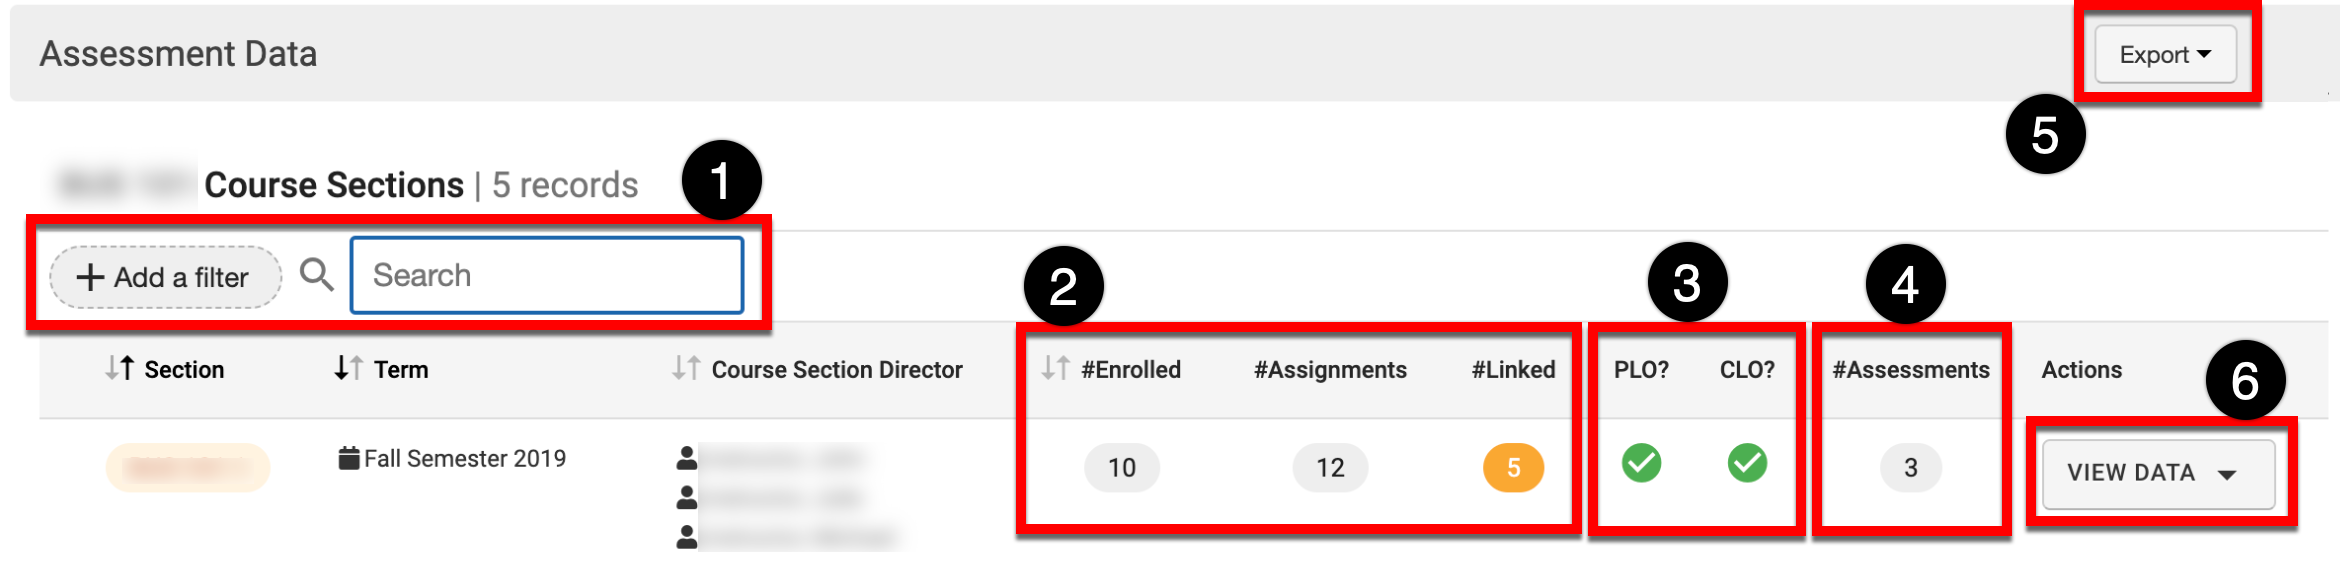
1 |
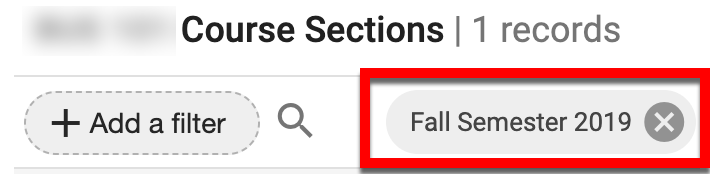
Search and filter functionality. If filters have been applied, they will appear next to the search field and can be removed by clicking the X. |
|
2 |
|
|
3 |
|
|
4 |
The count of assessments for the course section. |
|
5 |
By expanding the Export menu, assessment data can be exported to PDF and CSV formats or printed. |
|
6 |
Clicking View Data opens a menu with options to view Individual Data and Aggregate Data for associated assessments. |
Individual Data
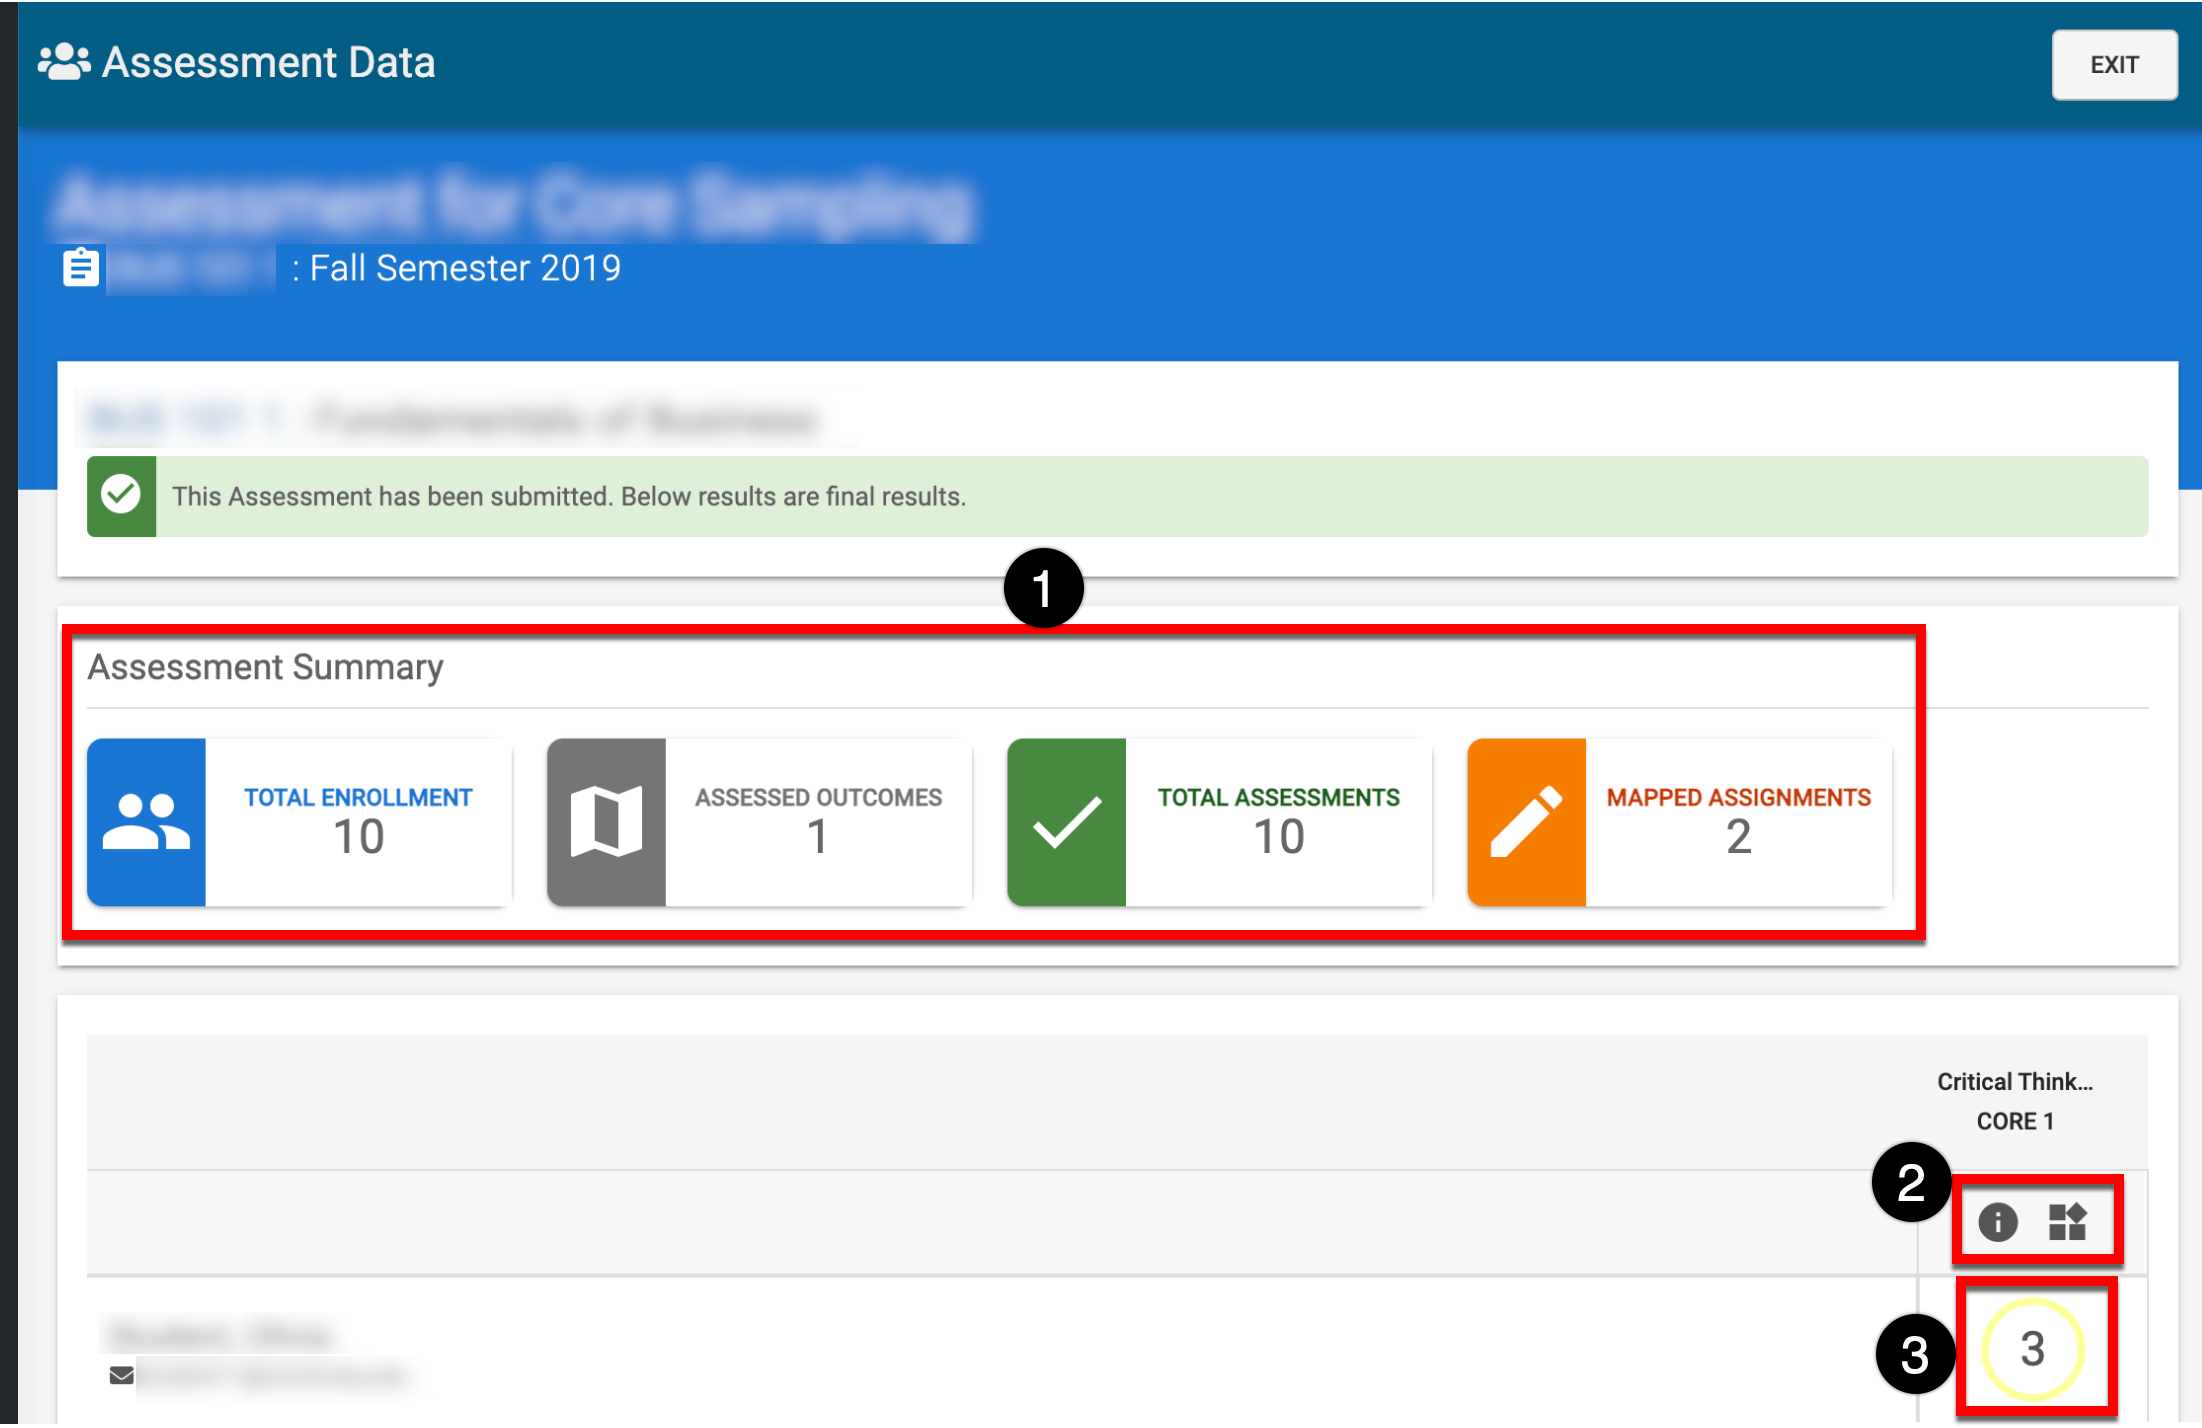
The Assessment Summary (1) displays the number of students enrolled in the course section, the number of outcomes assessed for the course section, the number of students assessed, and the number of assignments mapped to one or more outcomes.
Clicking the Mapping Information or the Proficiency Scale buttons (2) displays mapping and scale details. Clicking on the proficiency scale level for a student (3) displays the Assessment Details drawer:
-
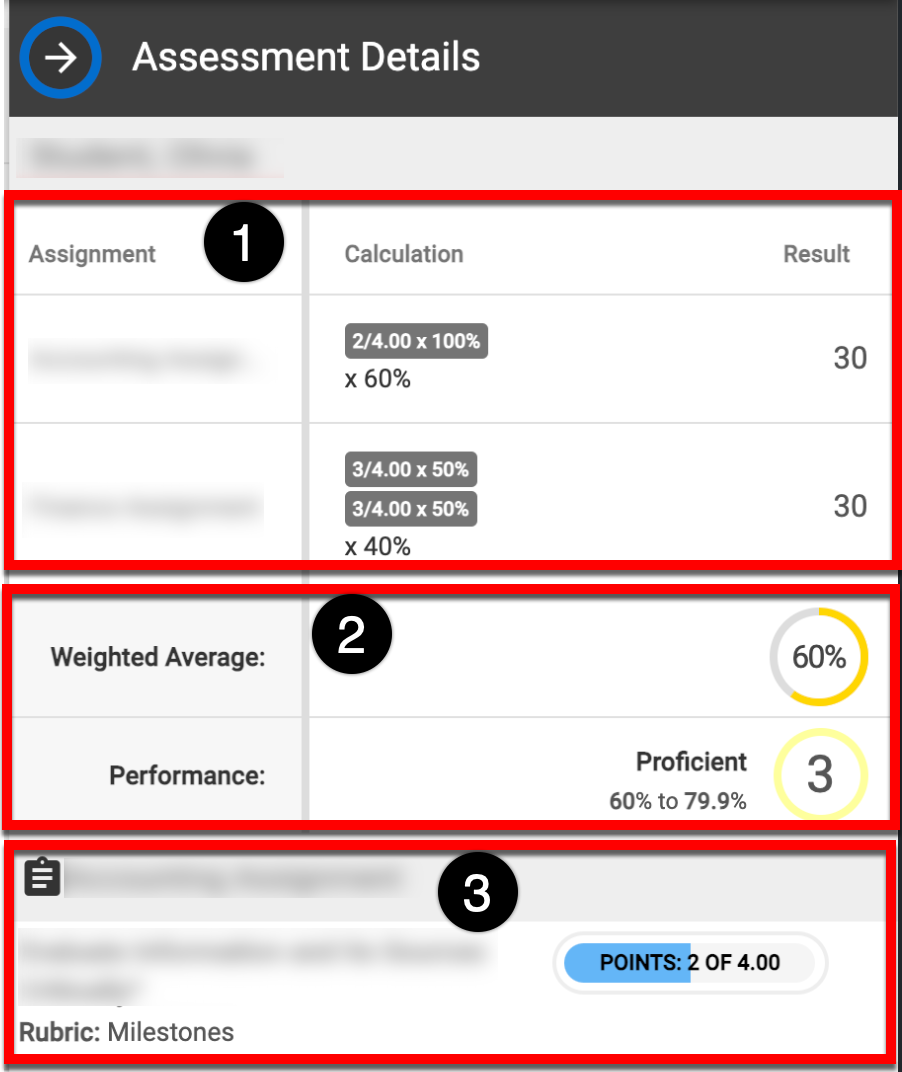
Assignment (1) displays the name of the assignment linked to the outcome. Calculation (1) shows the number of points divided by the max points multiplied by the assignment weight. Result (1) shows the points for each assignment based on the calculation.
-
The Weighted Average (2) is calculated by the ratio of the result to the total points that can be received. It is defined with four colors according to the completion percentage:
Red: 0% - 24.99%
Orange: 25% - 49.99%
Yellow: 50% - 74.99%
Green: 75% - 100%
Performance (2) displays the proficiency scale level correlated to the weighted average. -
Detailed assignment information includes assignment rubrics, quiz questions, and/or assignment submissions (3).
Assessment Data
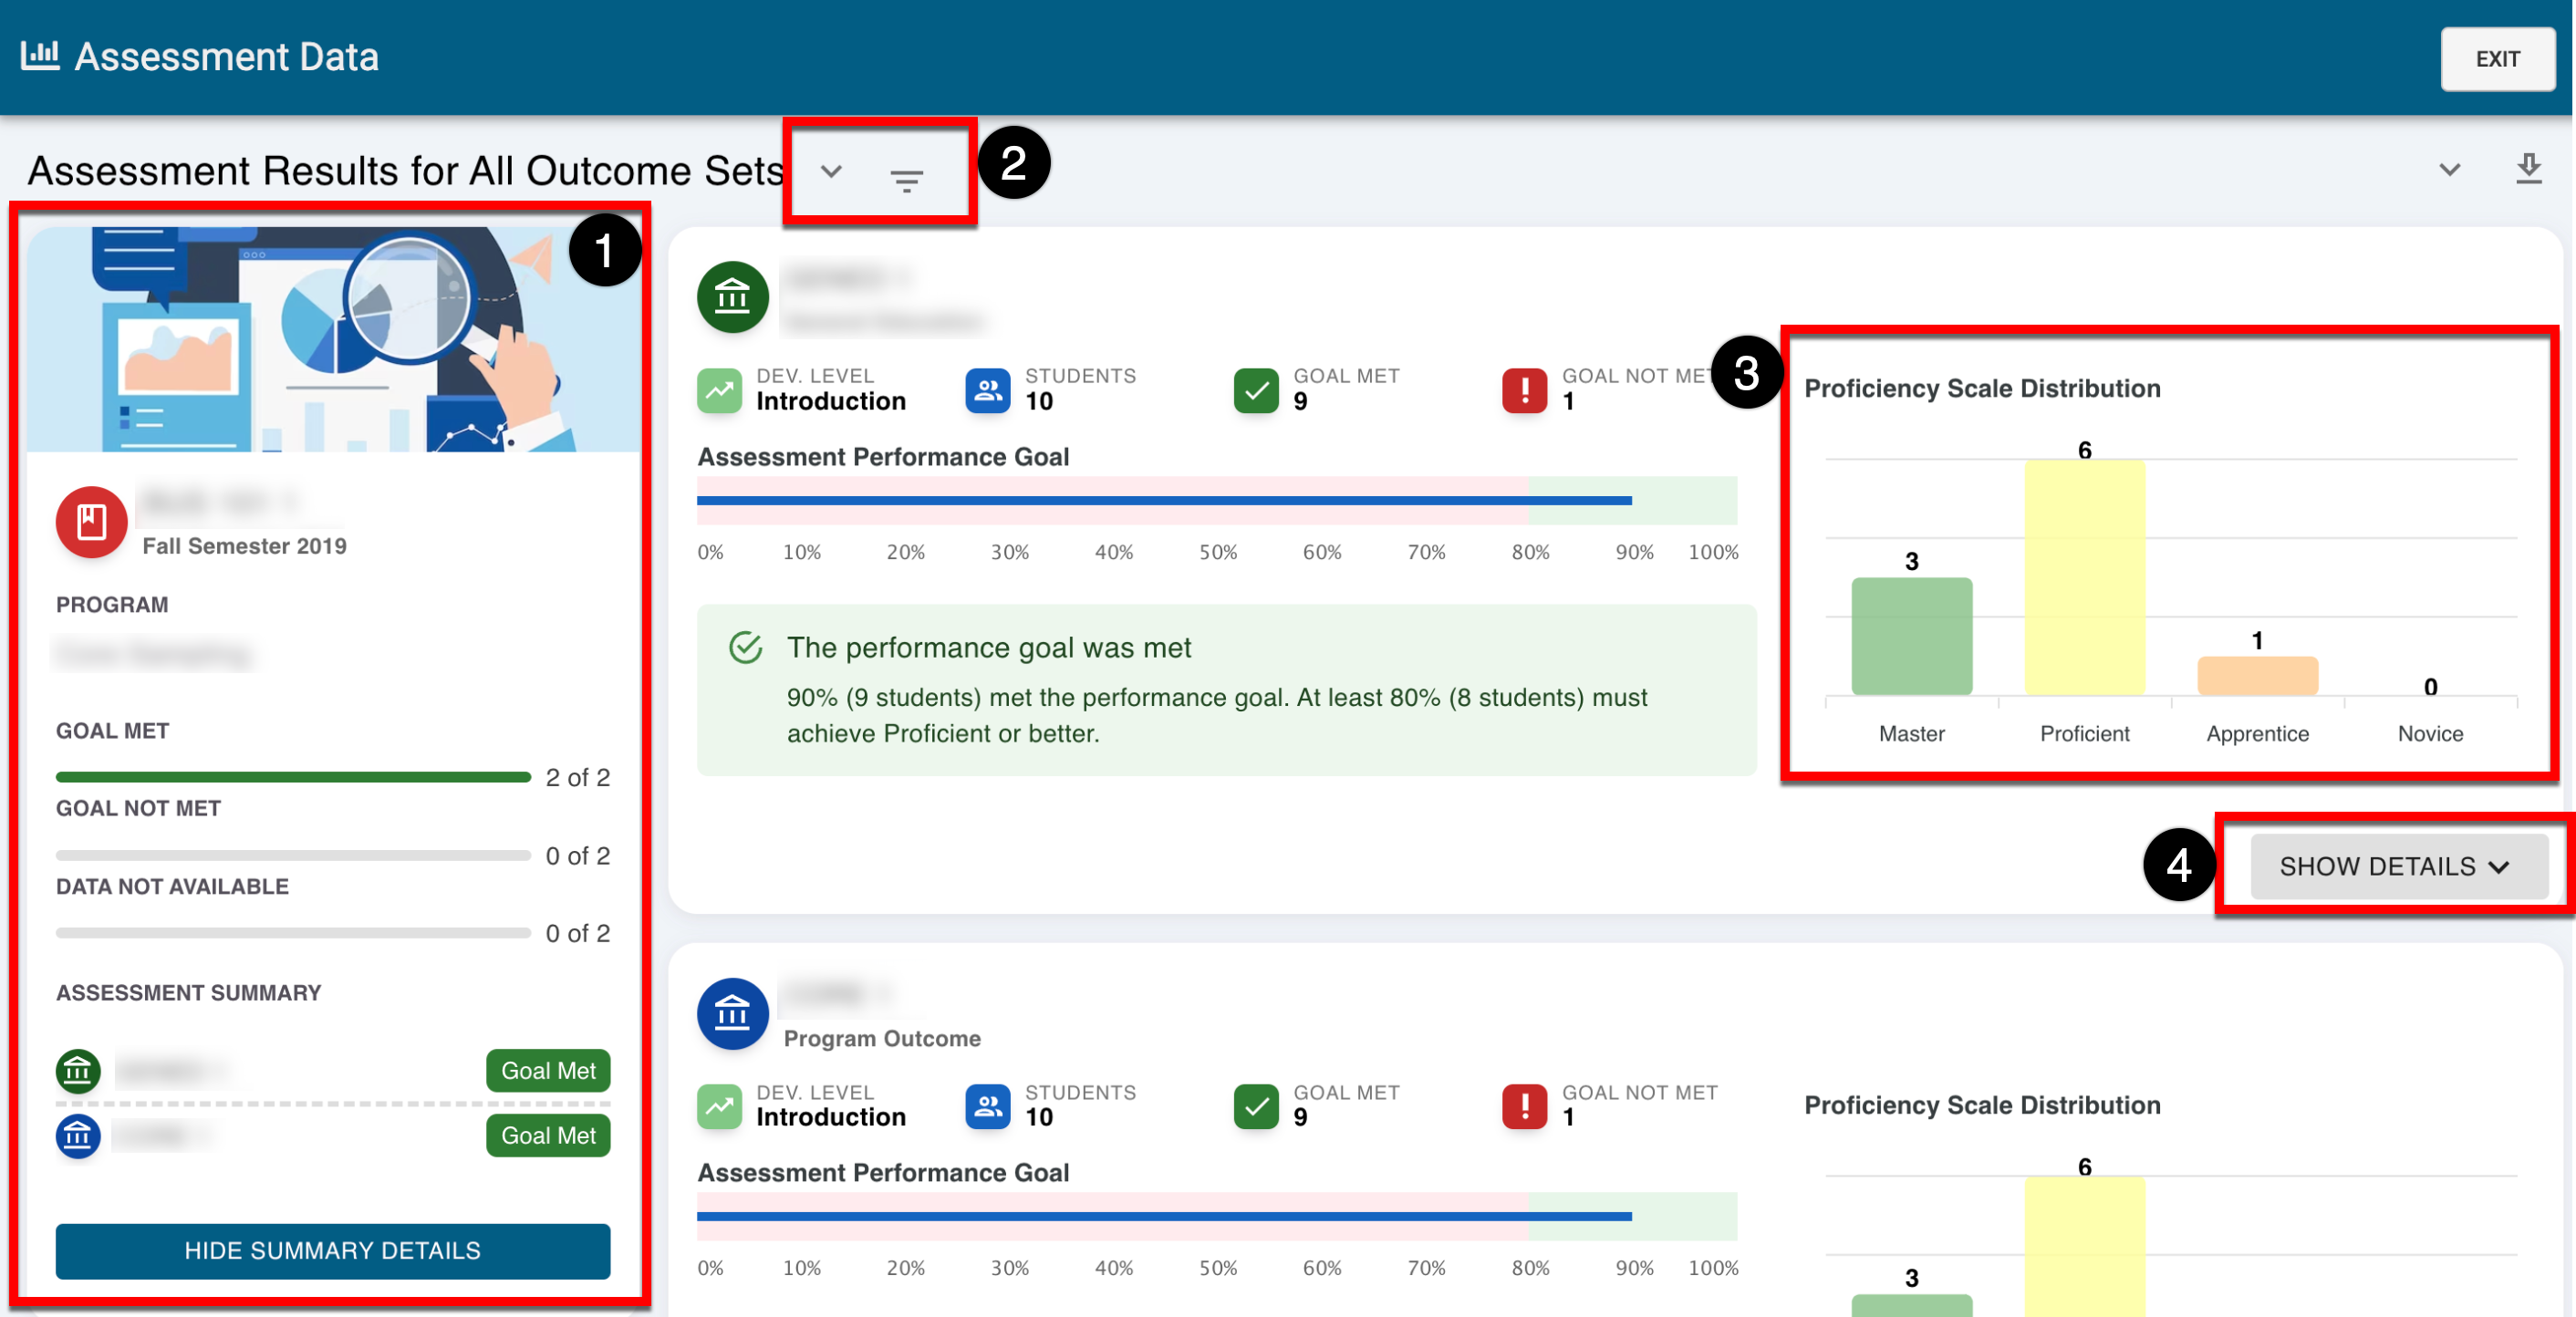
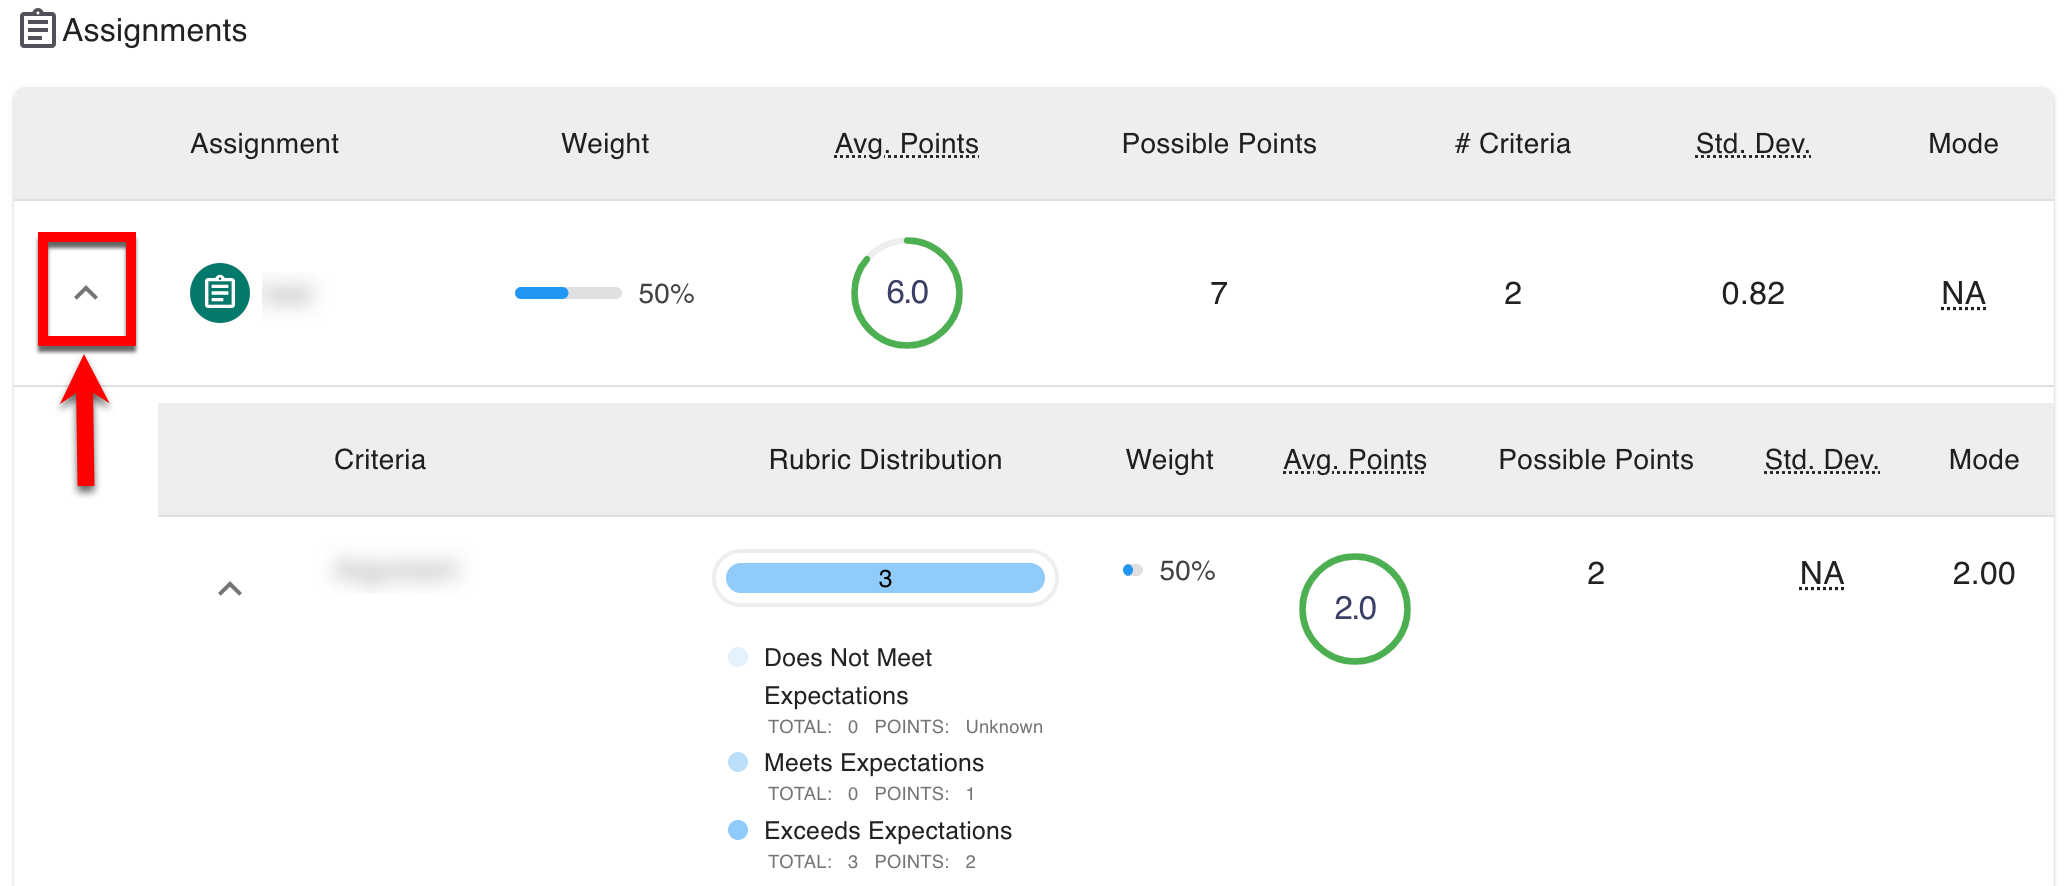
The assessment summary panel (1) displays quick information about the outcomes that have been met, not met, or no data available. The view can be changed between outcome sets by selecting the carrot icon (2), and by selecting the Filter Options icon (2), outcome sets can be filtered by degree and goal met/not met. The Proficiency Scale Distribution (3) graphs the total number of students that achieved each level of the proficiency scale. By clicking Show Details (4), detailed information can be reviewed regarding what was assessed and mapping information, assignments, rubric criteria, and quiz questions linked to the outcome; additional detail, including rubric information, can be shown by expanding each assignment.
Frequently Asked Questions