
Video Resource
Learn about viewing individual or aggregate assessment data by watching a quick walkthrough video!
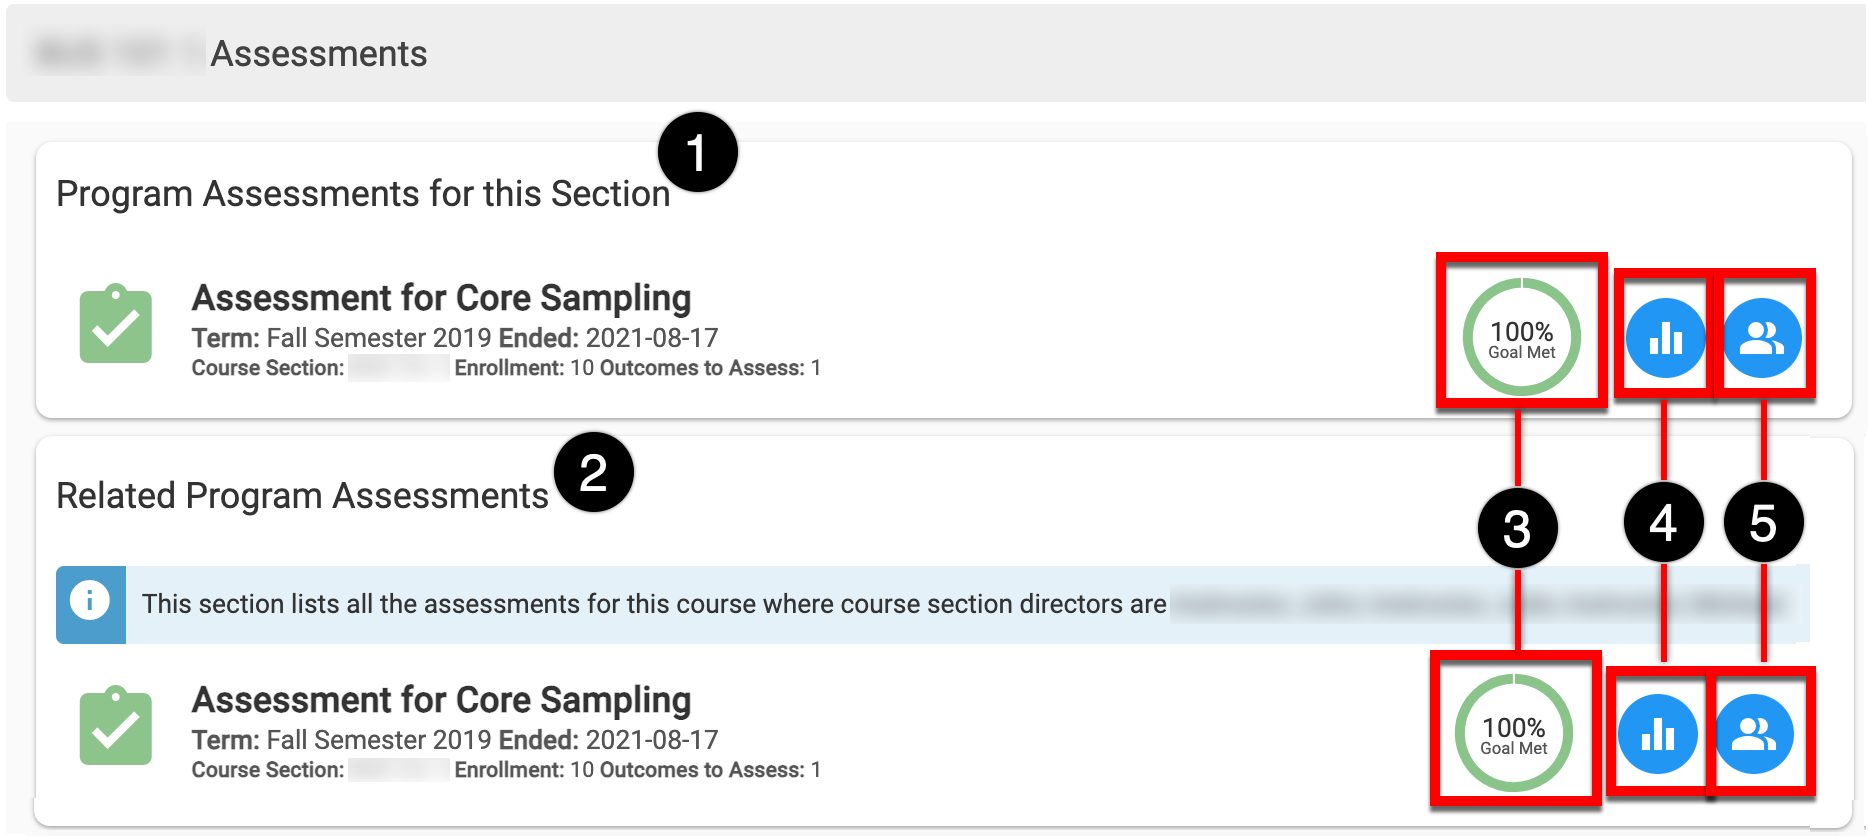
The course section Assessment Data page displays Program Assessments for related course sections (1) and all assessments for a course where the course section director is the same (2). Hovering over Goal Met (3) displays quick glance information about outcomes and goal met/not met metrics. Assessment results can be viewed by clicking the View Results option (4) for details on all outcome sets or for individual assessment results by clicking the View Individual Data option (5).
The View Results button will be unavailable if no assignments have been linked to one or more outcomes.
Individual Data
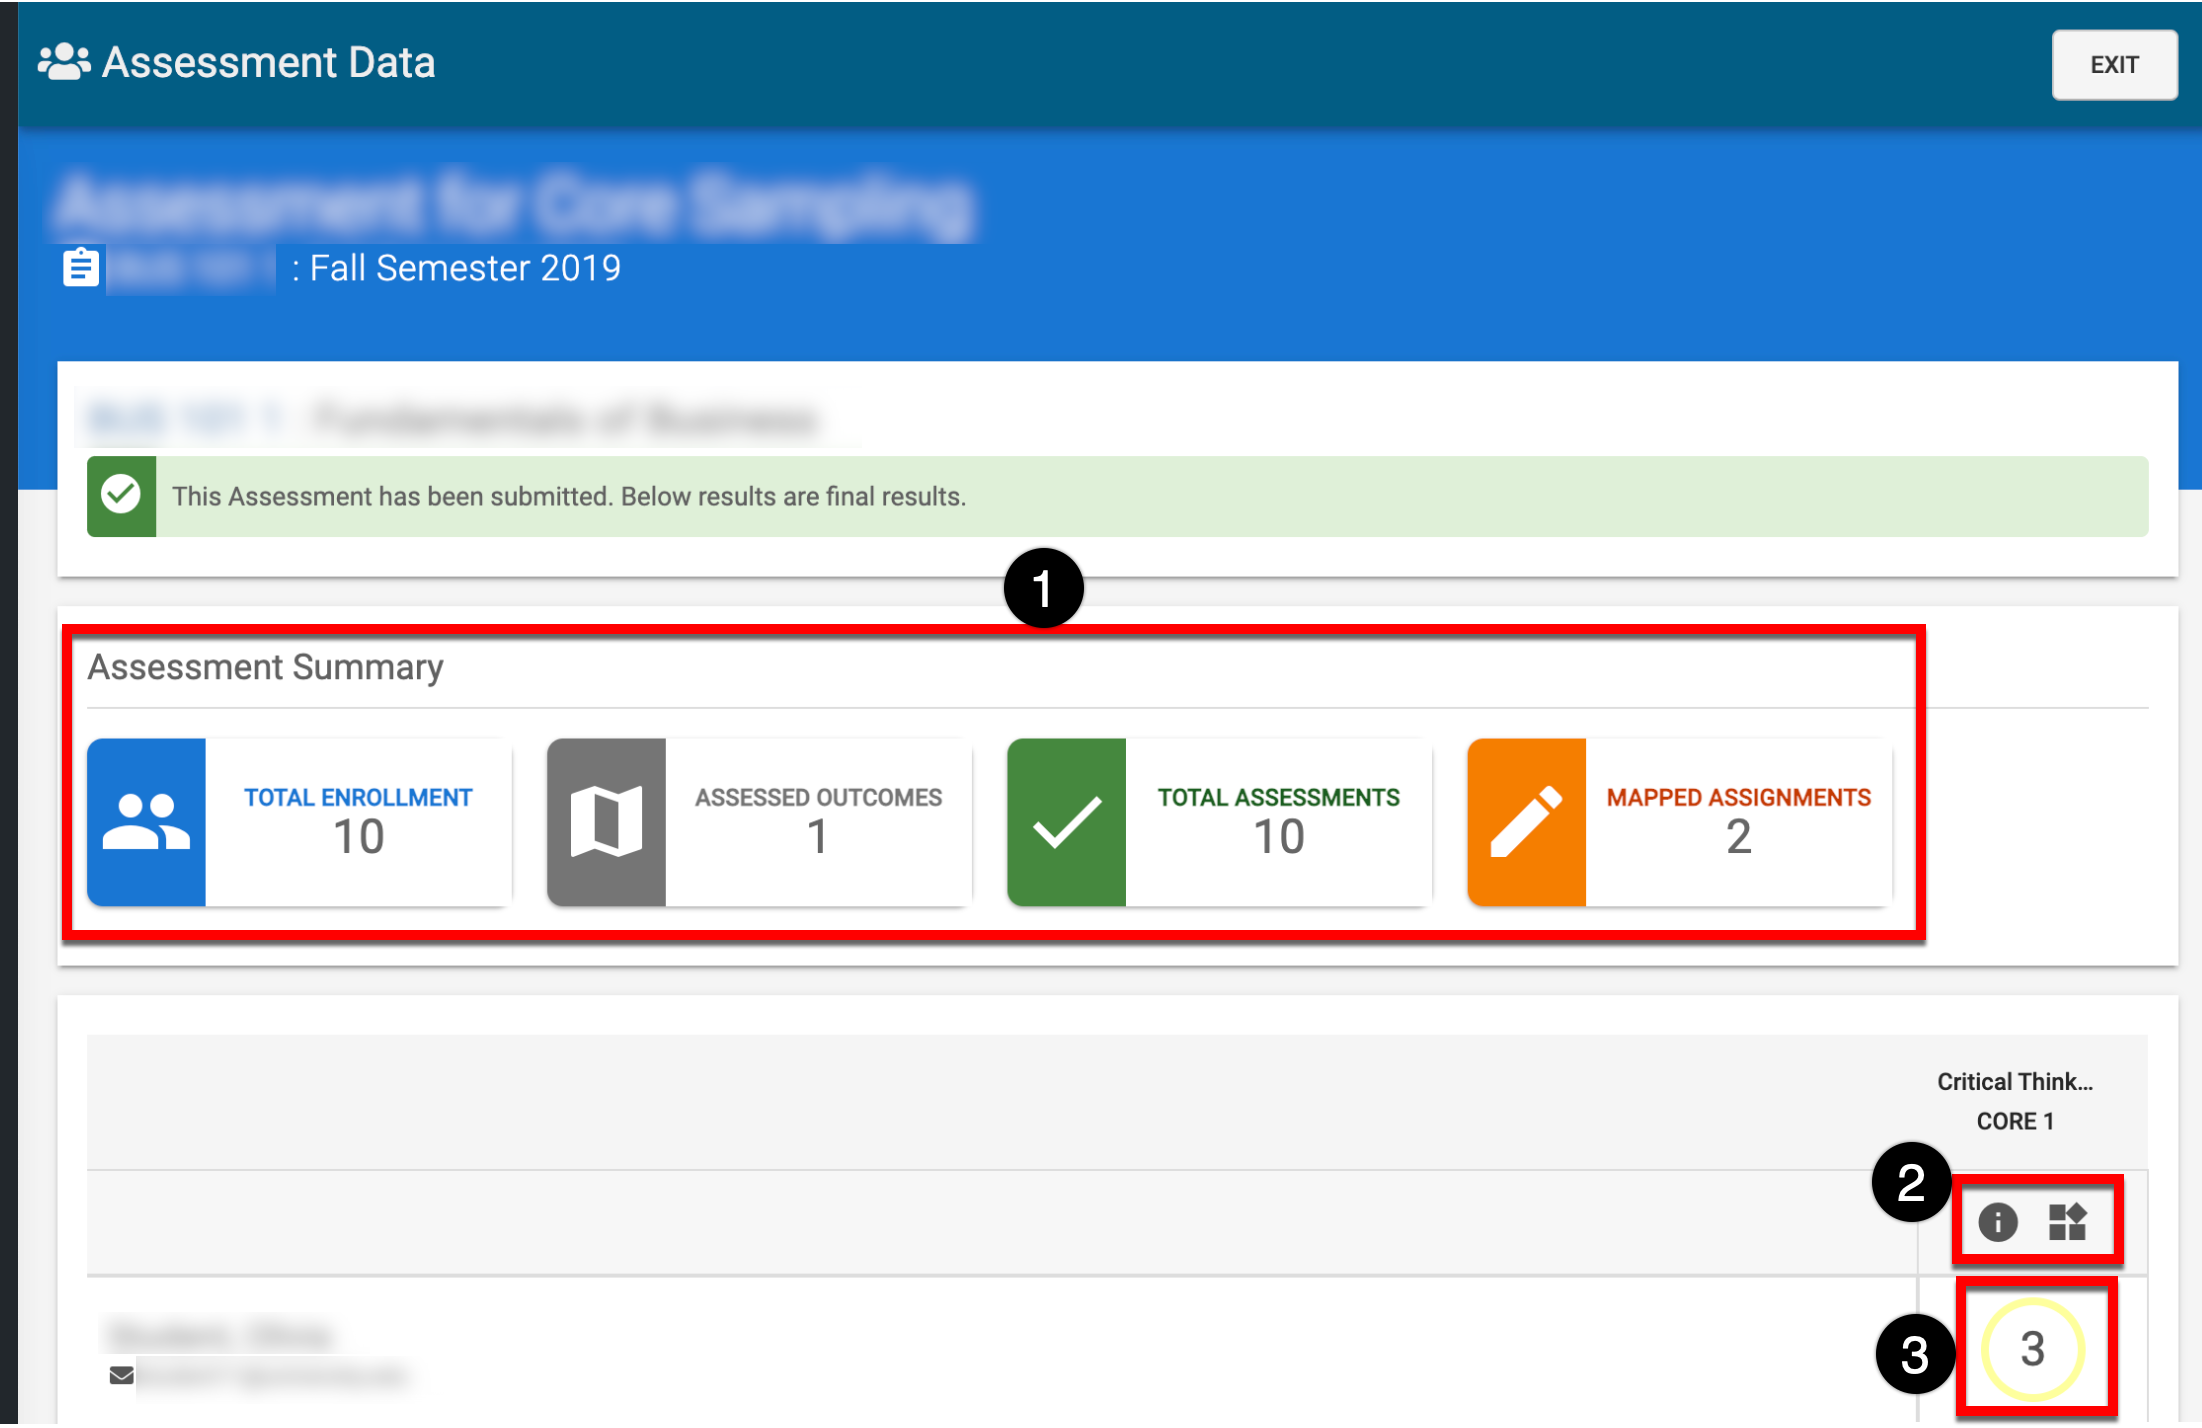
The Assessment Summary (1) displays the number of students enrolled in the course section, the number of outcomes assessed for the course section, the number of students assessed, and the number of assignments mapped to one or more outcomes. Clicking the Mapping Information or the Proficiency Scale buttons (2) displays mapping and scale details. Clicking on the proficiency scale level for a student (3) shows the Assessment Details drawer:
-
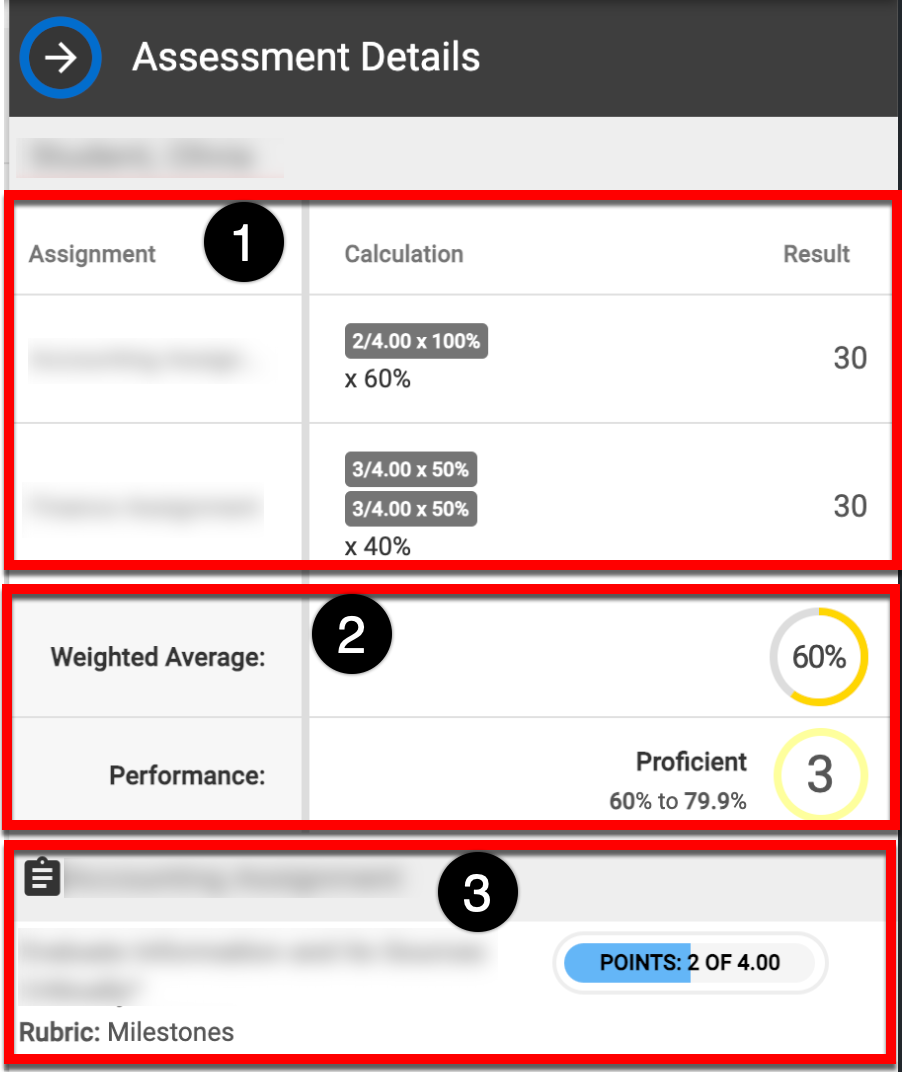
Assignment (1) displays the name of the assignment linked to the outcome. Calculation (1) shows the number of points divided by the maximum points multiplied by the assignment weight. Result (1) shows the points for each assignment based on the calculation.
-
The Weighted Average (2) is calculated by the ratio of the result to the total points that can be received. It is defined with four colors according to the completion percentage:
Red: 0% - 24.99%
Orange: 25% - 49.99%
Yellow: 50% - 74.99%
Green: 75% - 100%
Performance (2) displays the proficiency scale level correlated to the weighted average. -
Detailed assignment information includes assignment rubrics, quiz questions, and assignment submissions (3).
View Results
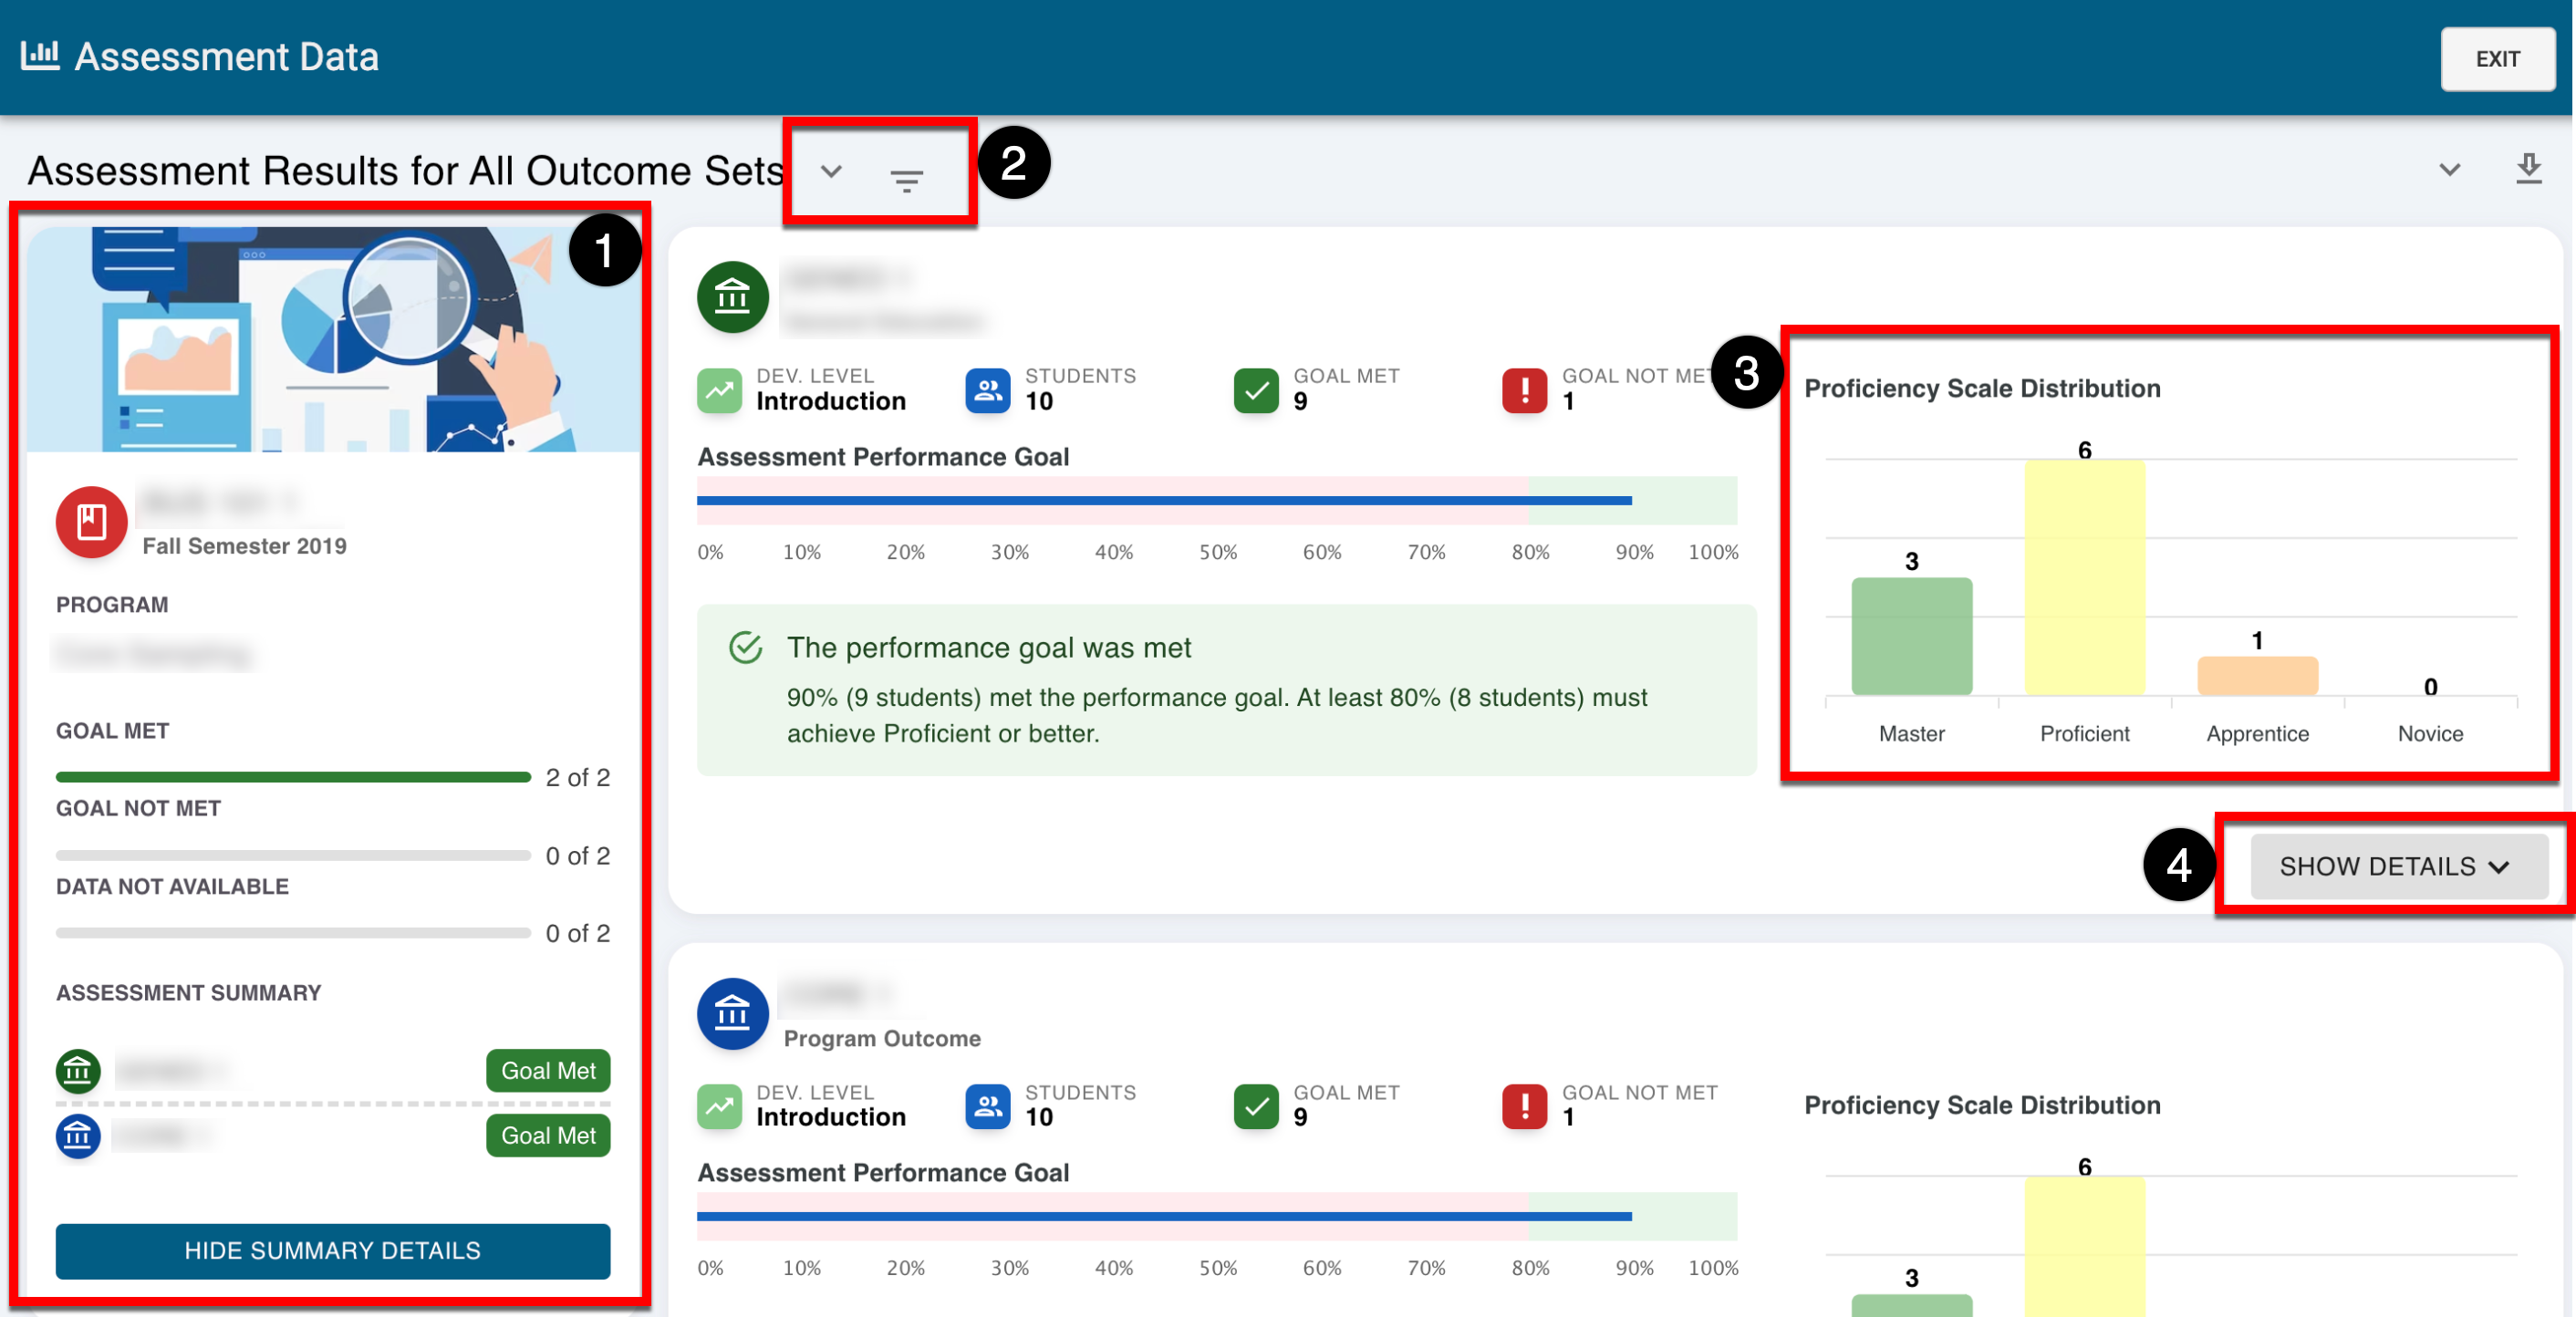
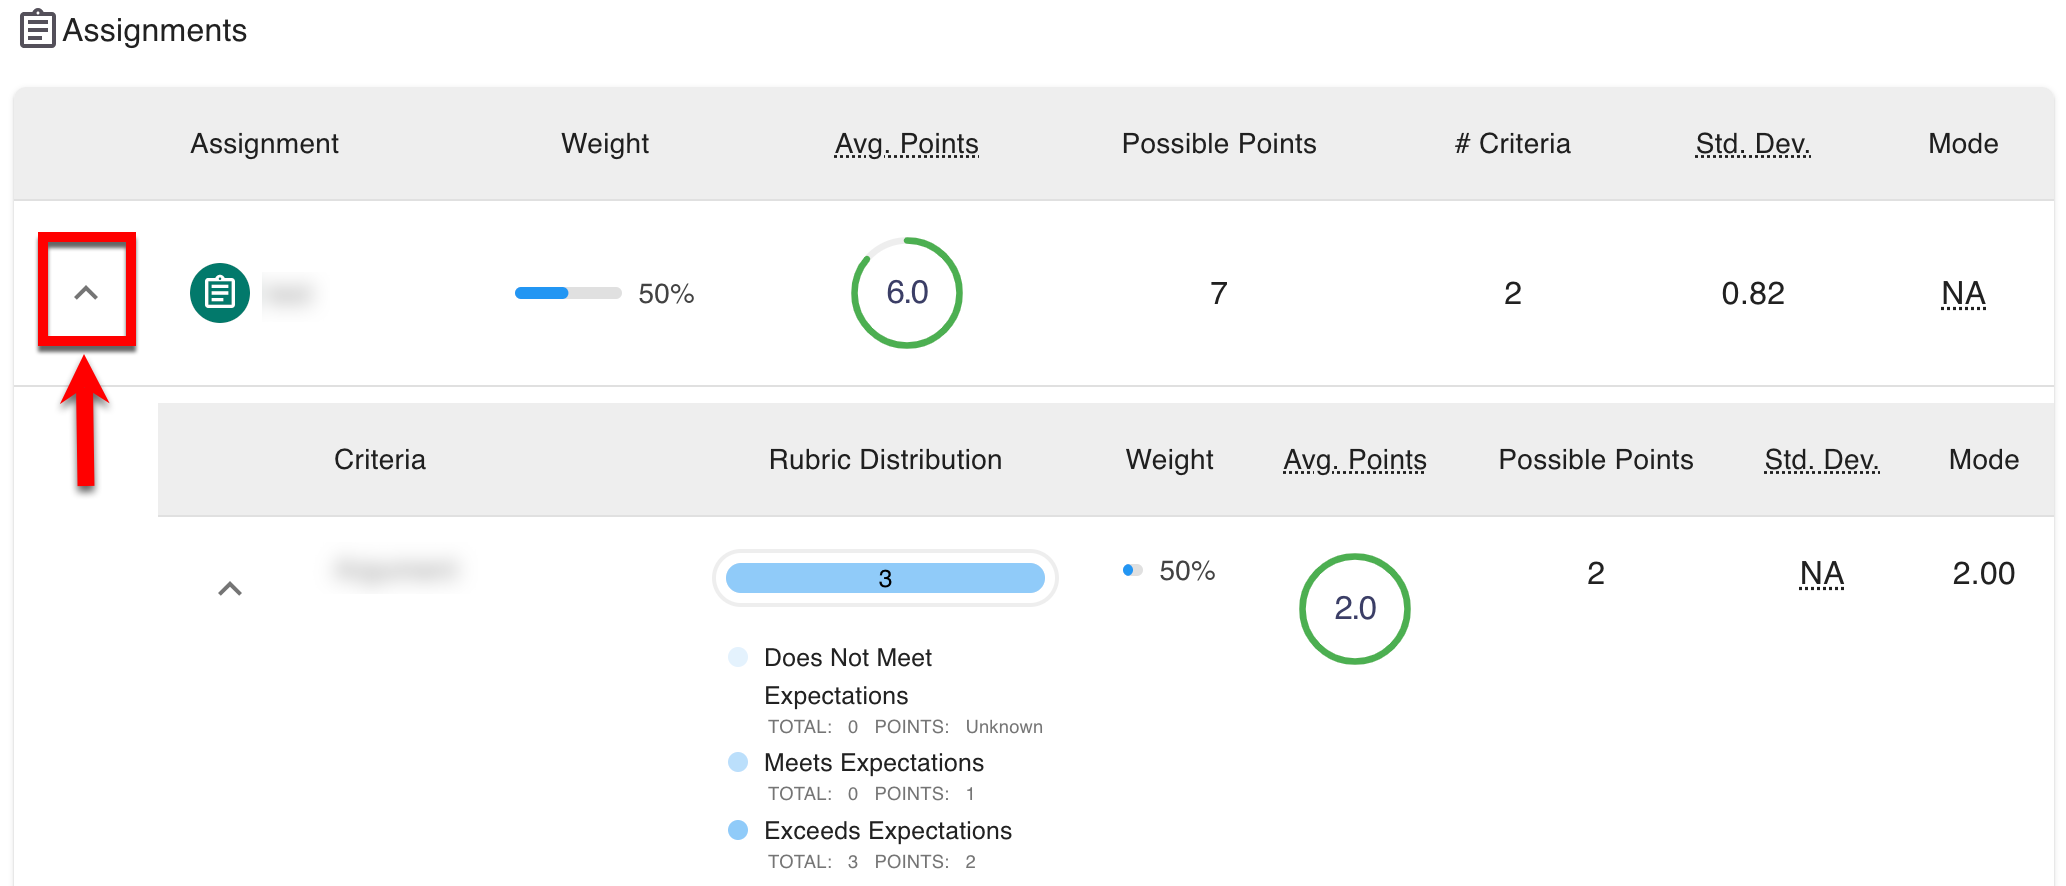
The assessment summary panel (1) displays quick information about the outcomes that have been met, not met, or for which no data is available. The view can be changed between outcome sets by selecting the carrot icon(2), and by selecting the Filter Options icon (2), outcome sets can be filtered by degree and goal met/not met. The Proficiency Scale Distribution (3) graphs the total number of students who achieved each level of the proficiency scale. By clicking Show Details (4), detailed information can be reviewed regarding what was assessed and mapping information, assignments, rubric criteria, and quiz questions linked to the outcome; additional detail, including rubric information, can be shown by expanding each assignment.