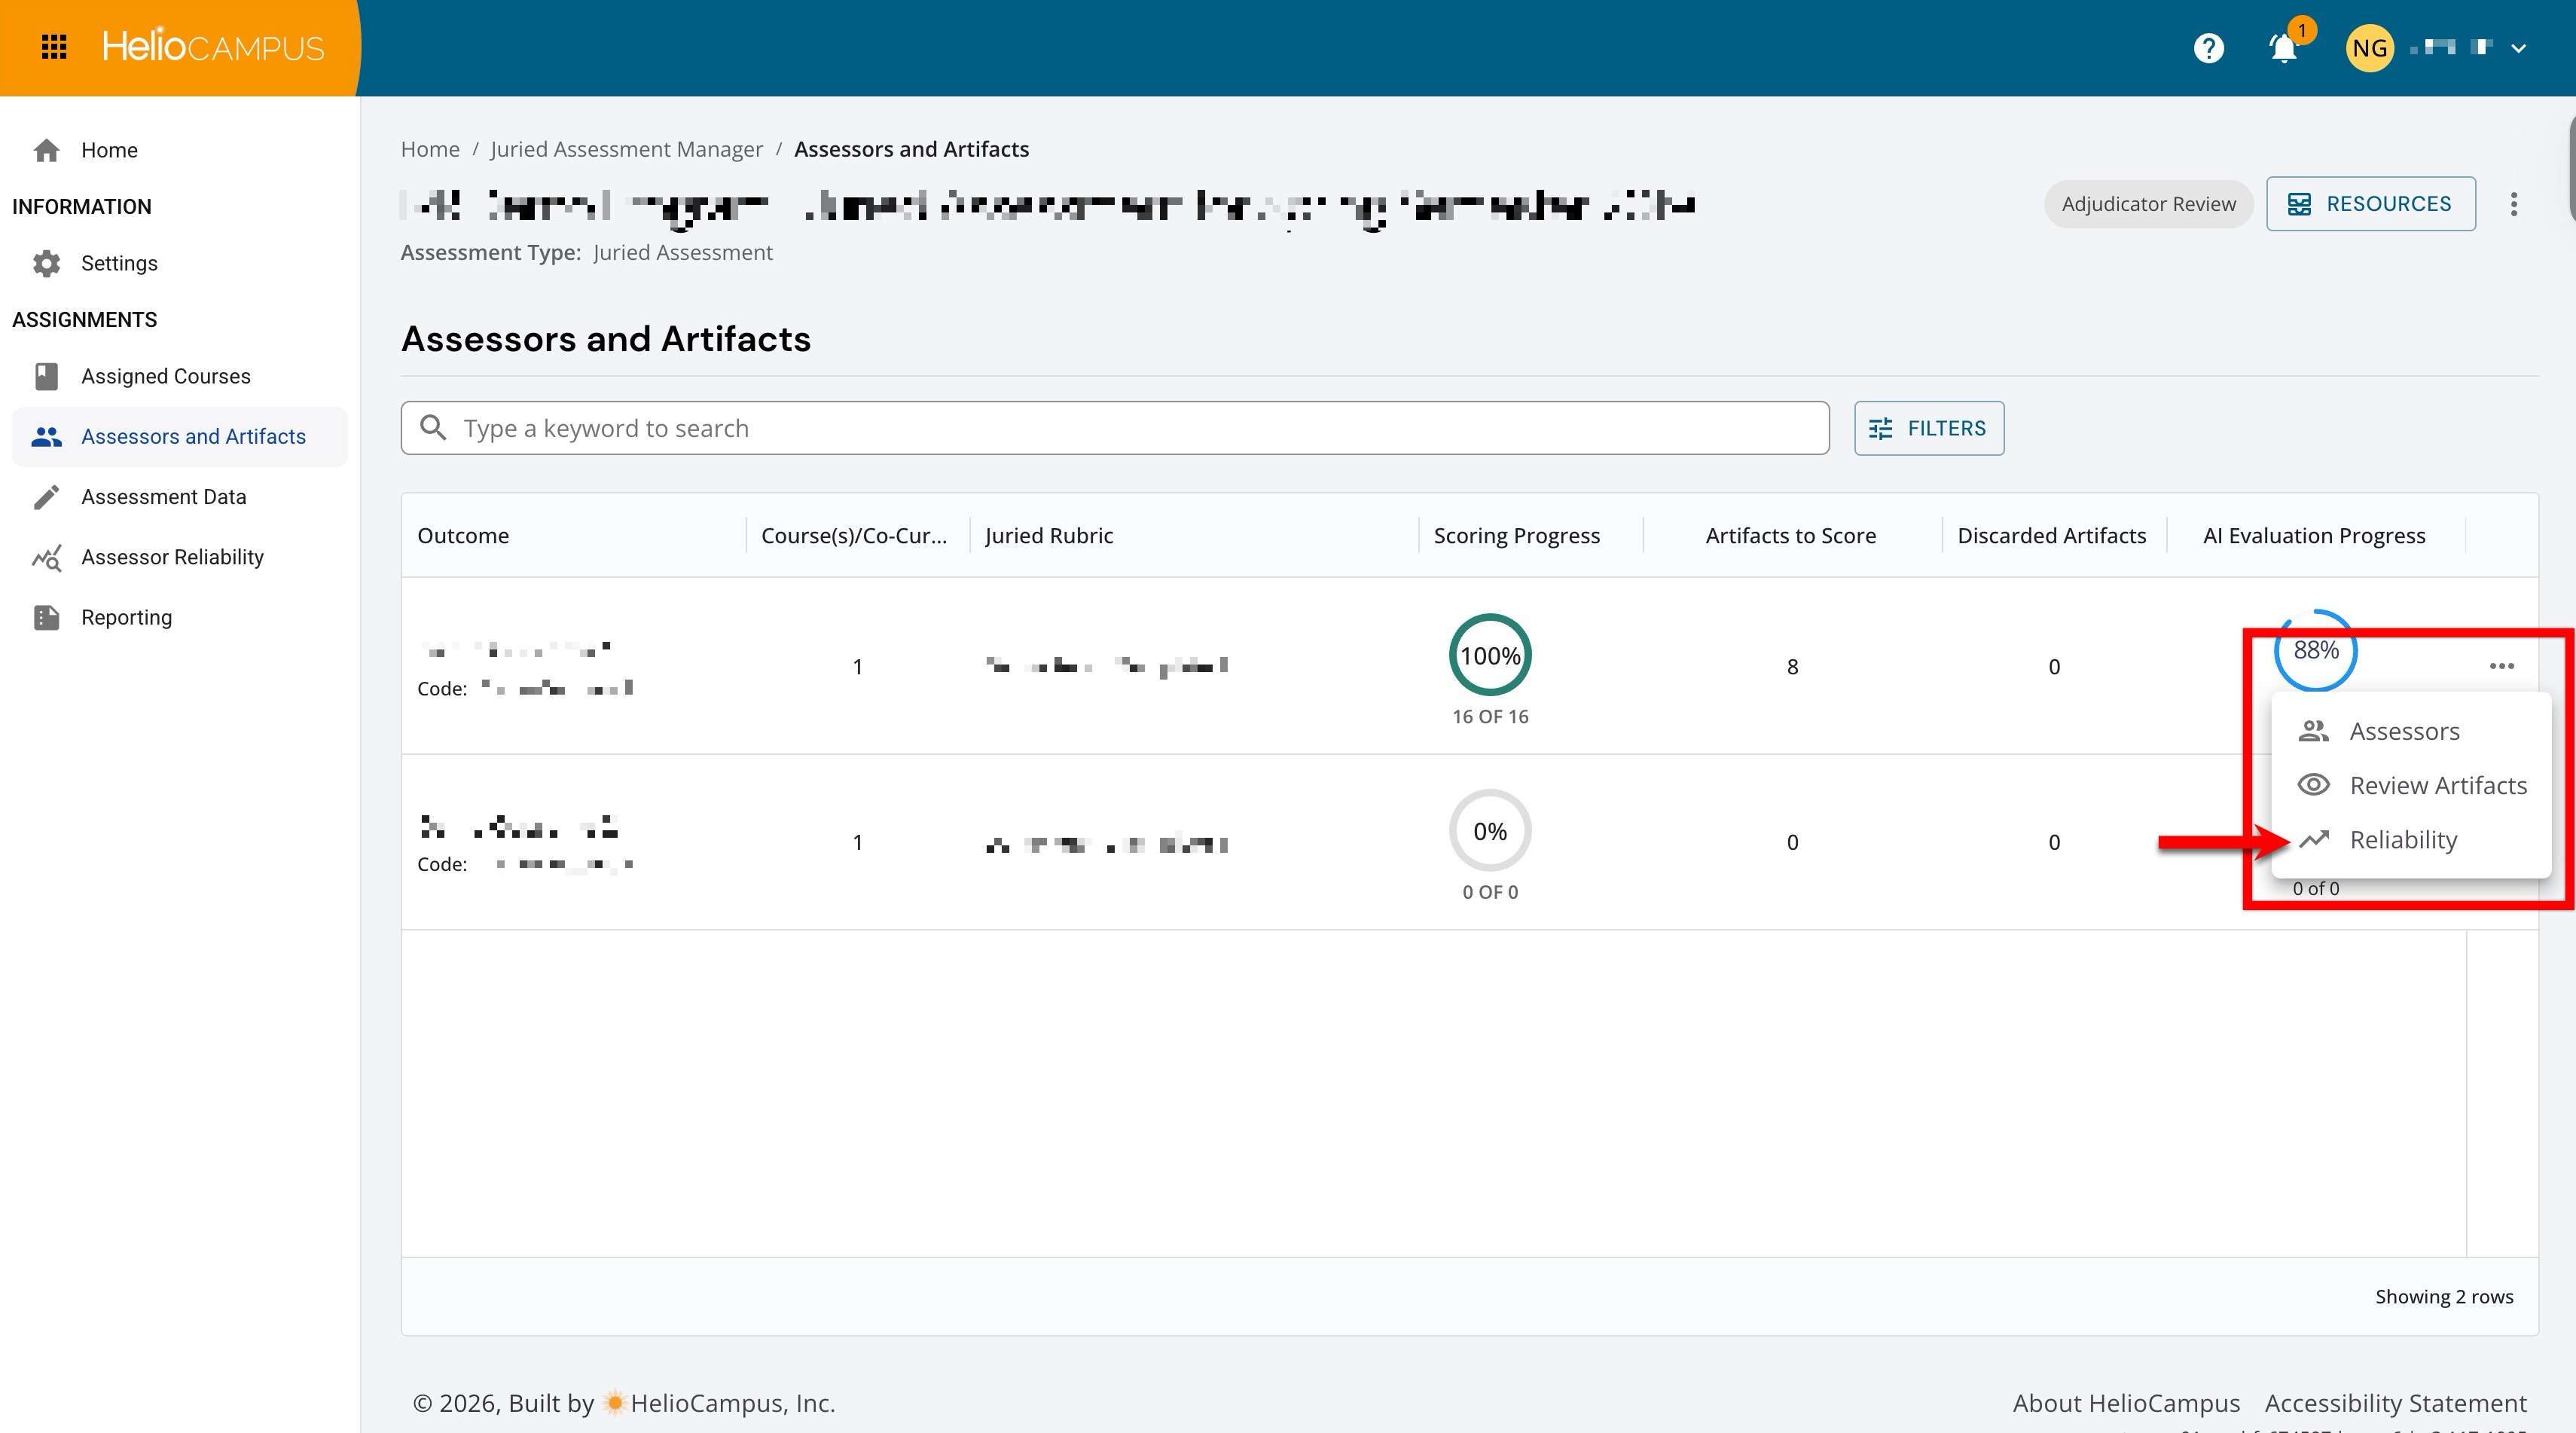
When Inter-Rater Reliability is enabled, reliability metrics can be accessed from the Assessors and Artifacts page. The Reliability page is an analytics view within a Juried Assessment. It does not create or store its own records; it reads the scores that assessors submit for outcomes' artifacts. Selecting Reliability opens a full-page view for that single outcome only.
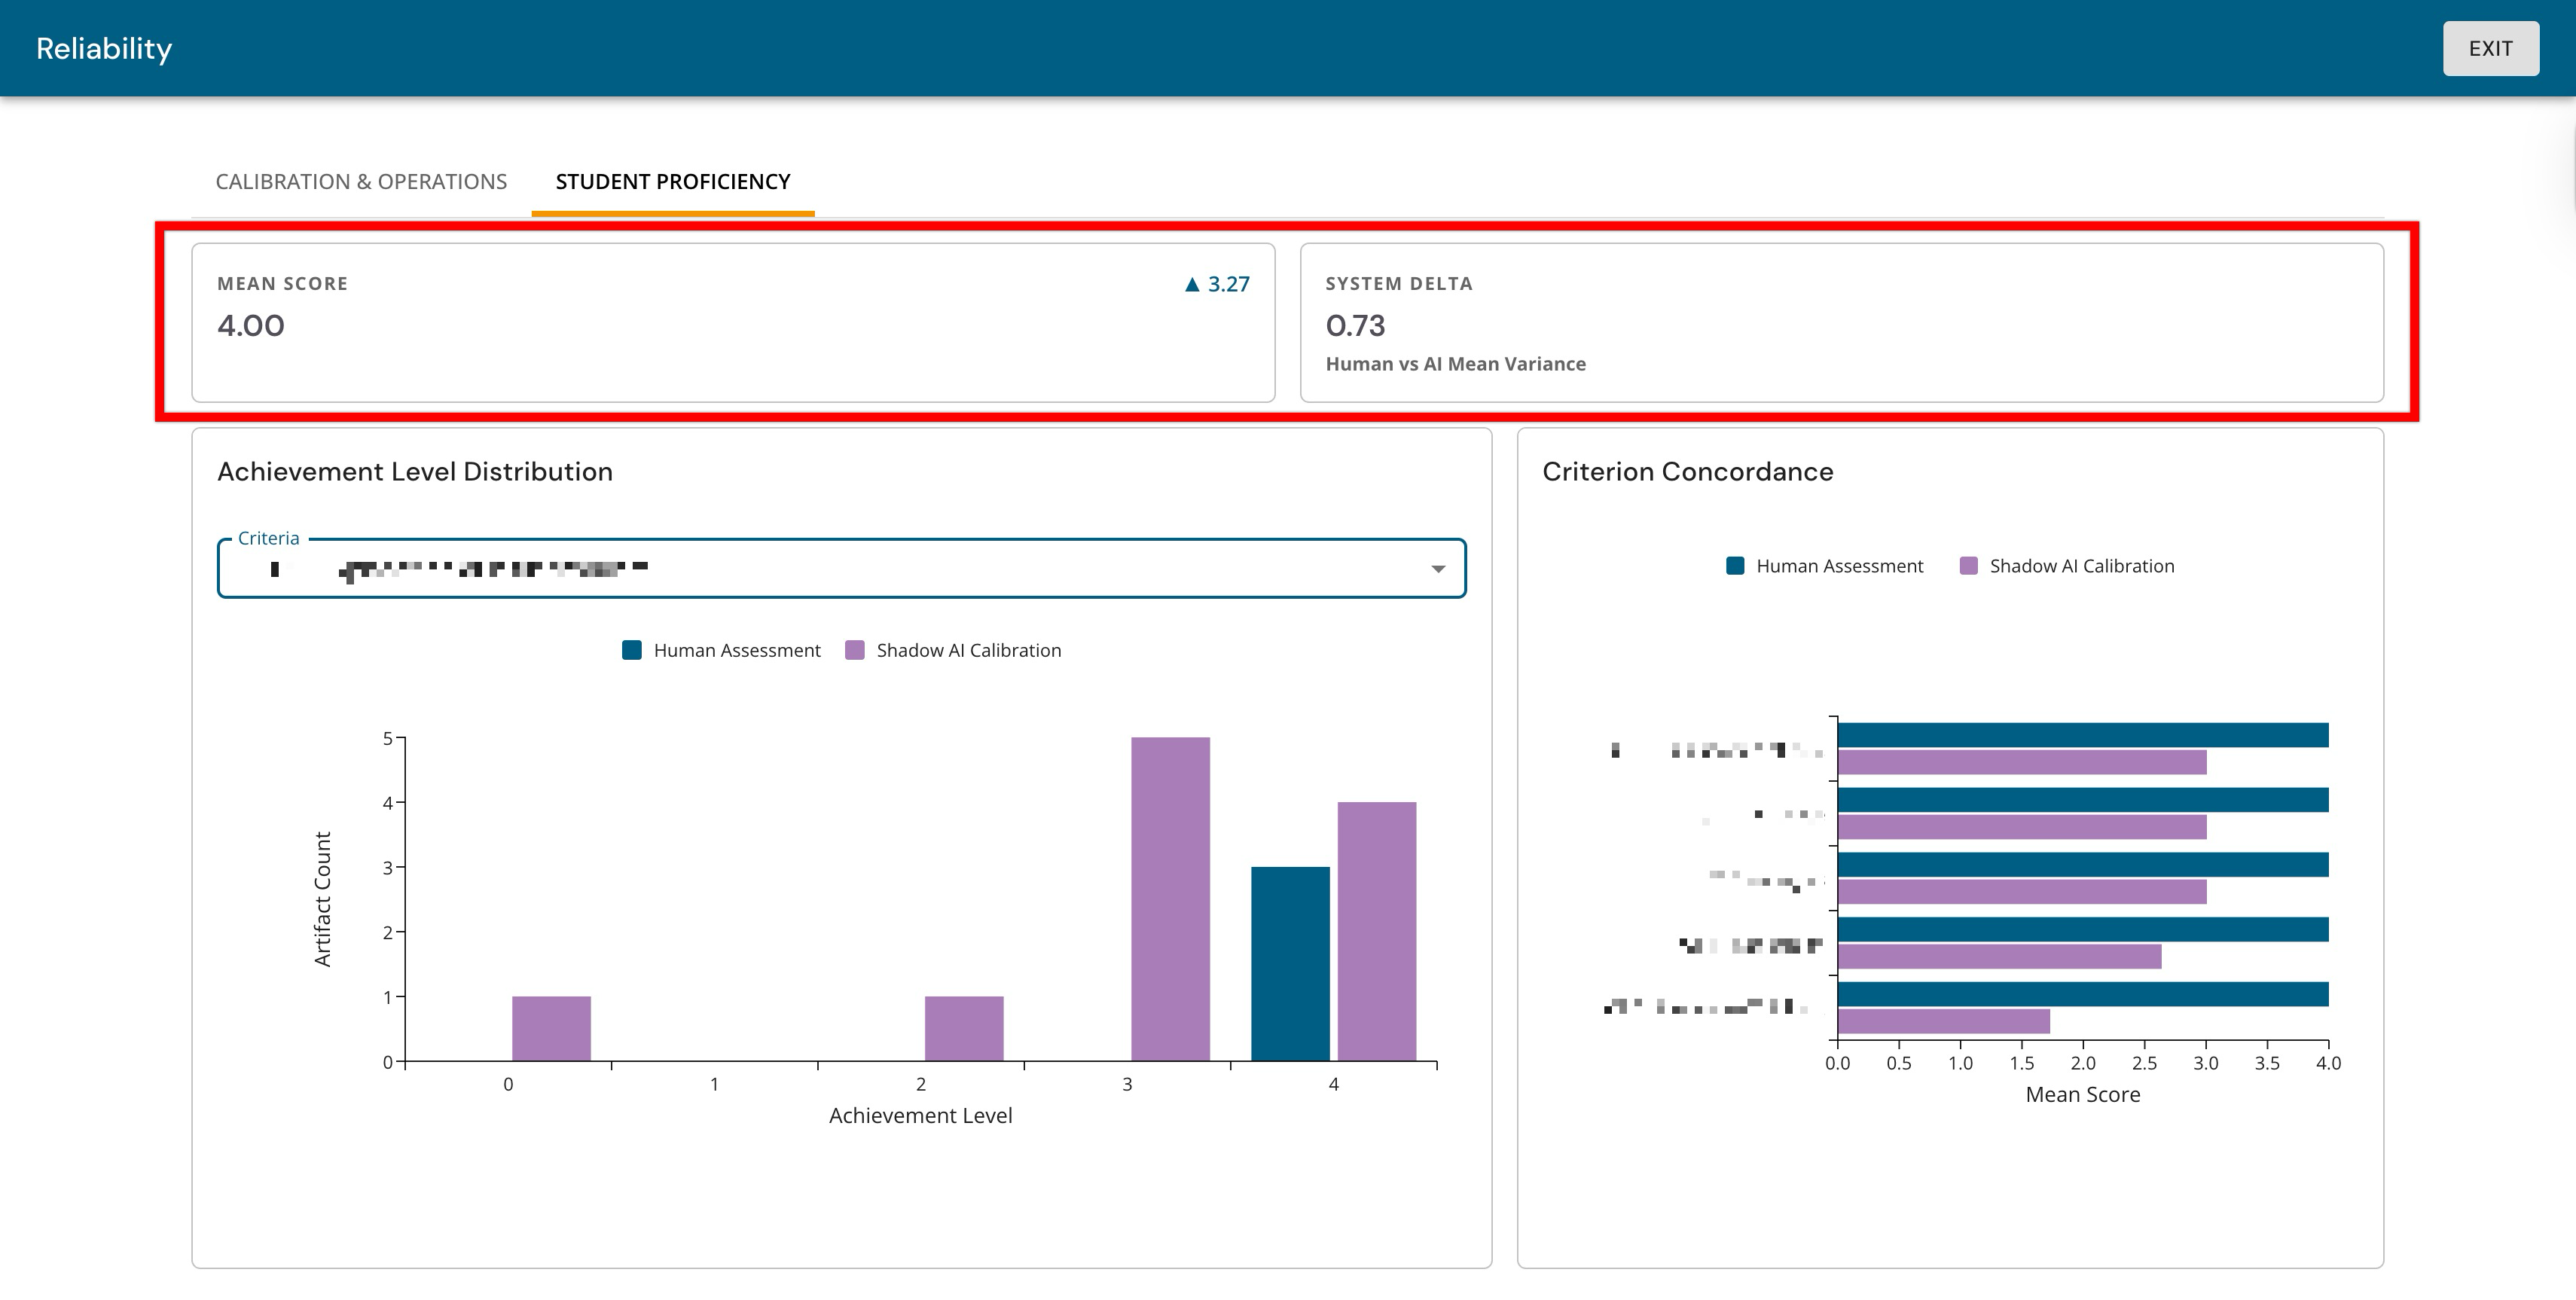
The Reliability page opens on the Calibration & Operations tab. Select the Student Proficiency tab, review data on student scores vs. AI shadow scores, and how closely they relate to each other. The summary row provides an at-a-glance read of the data.
-
Mean Score: The overall average proficiency score that can be interpreted as the average of student scores for the selected outcome. Starting here helps to understand the overall level of performance before reviewing further. The additional small number/indicator near is the trend indicator that can be used as a comparison signal.
-
System Delta: This is the mean assessor score vs. the mean AI score, summarized as a single number, indicating how far apart the assessor mean and the AI shadow mean are. This can be used as a quick alignment check; even if the mean AI score looks reasonable, a high system delta signals that AI and assessors are interpreting performance differently.
-
Smaller Delta: Closer alignment between AI and assessor scoring at the overall level.
-
Larger Delta: More separation between AI and assessor scoring at the overall level.
-
Achievement Level Distribution
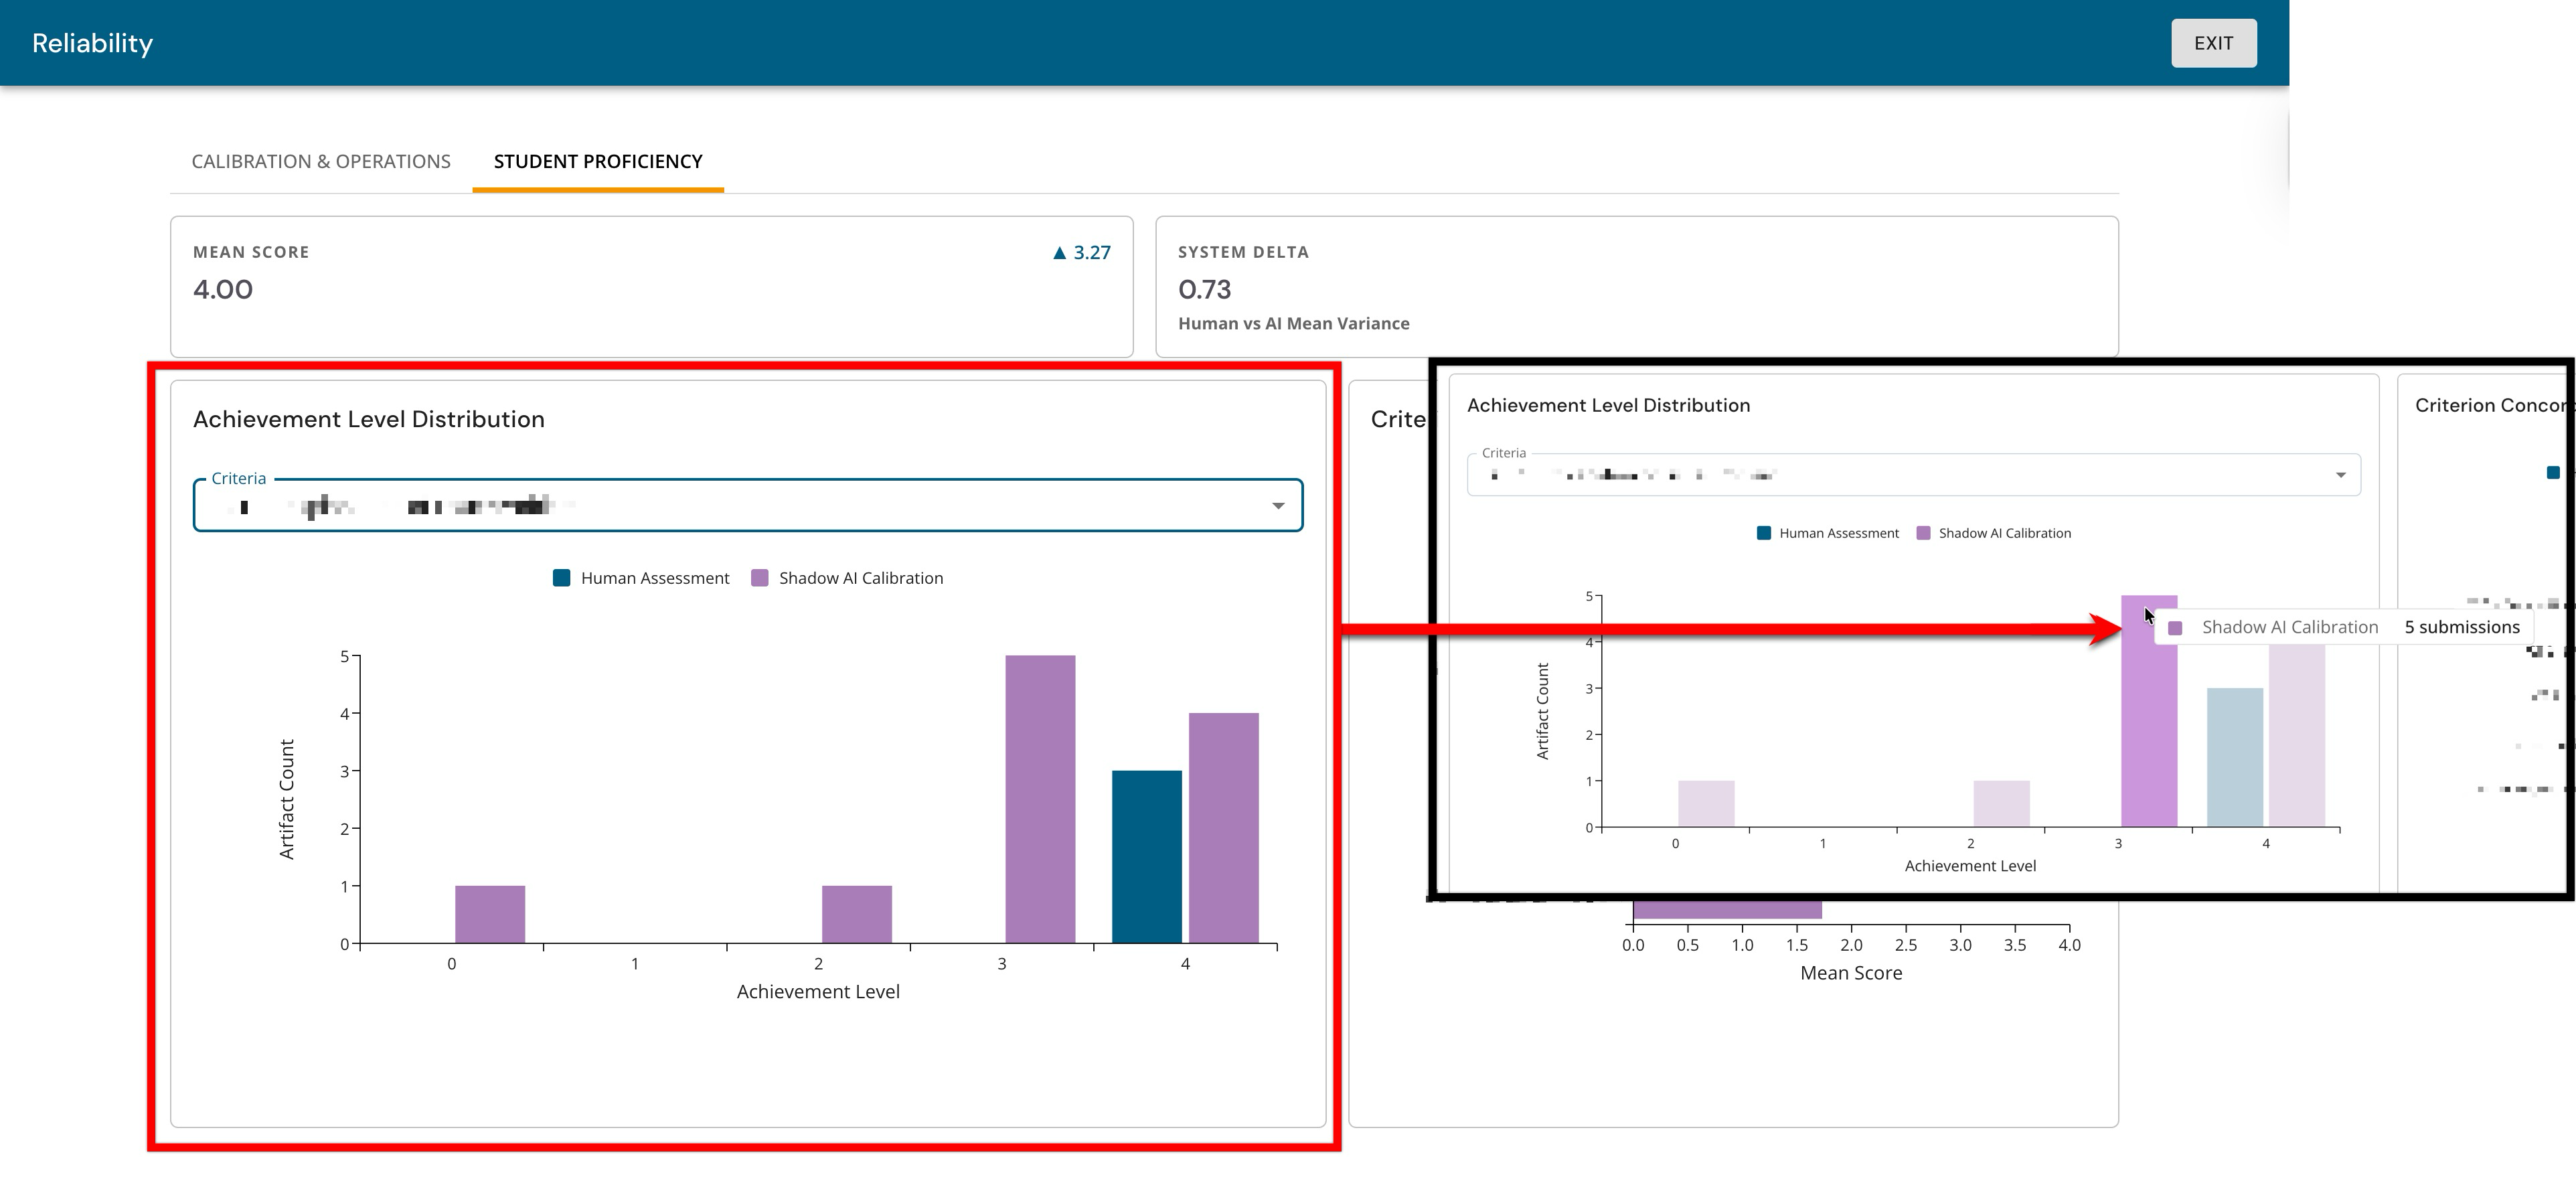
The Achievement Level Distribution chart displays how many artifacts landed in each achievement level for both assessor scoring (blue) and Shadow AI scoring (purple). Criterion can be chosen from the dropdown at the top to view the distribution. Once a criterion has been selected, the chart is no longer overall and instead becomes criterion-specific. Hovering over a bar segment displays a tooltip showing the scorer's name (assessor vs Shadow AI) and the count of submissions/artifacts at that criterion level.
|
If |
Then |
|---|---|
|
If the blue and purple bars are similar across levels |
The AI shadow is scoring artifacts similarly to the assessors |
|
If purple clusters are higher while blue is lower |
AI is generally more generous with scoring than the assessors for that criterion (or vice versa) |
Product Tip
When Institutions suspect a specific part of a rubric is causing inconsistency, the criteria can be selected to see whether distributions shift dramatically.
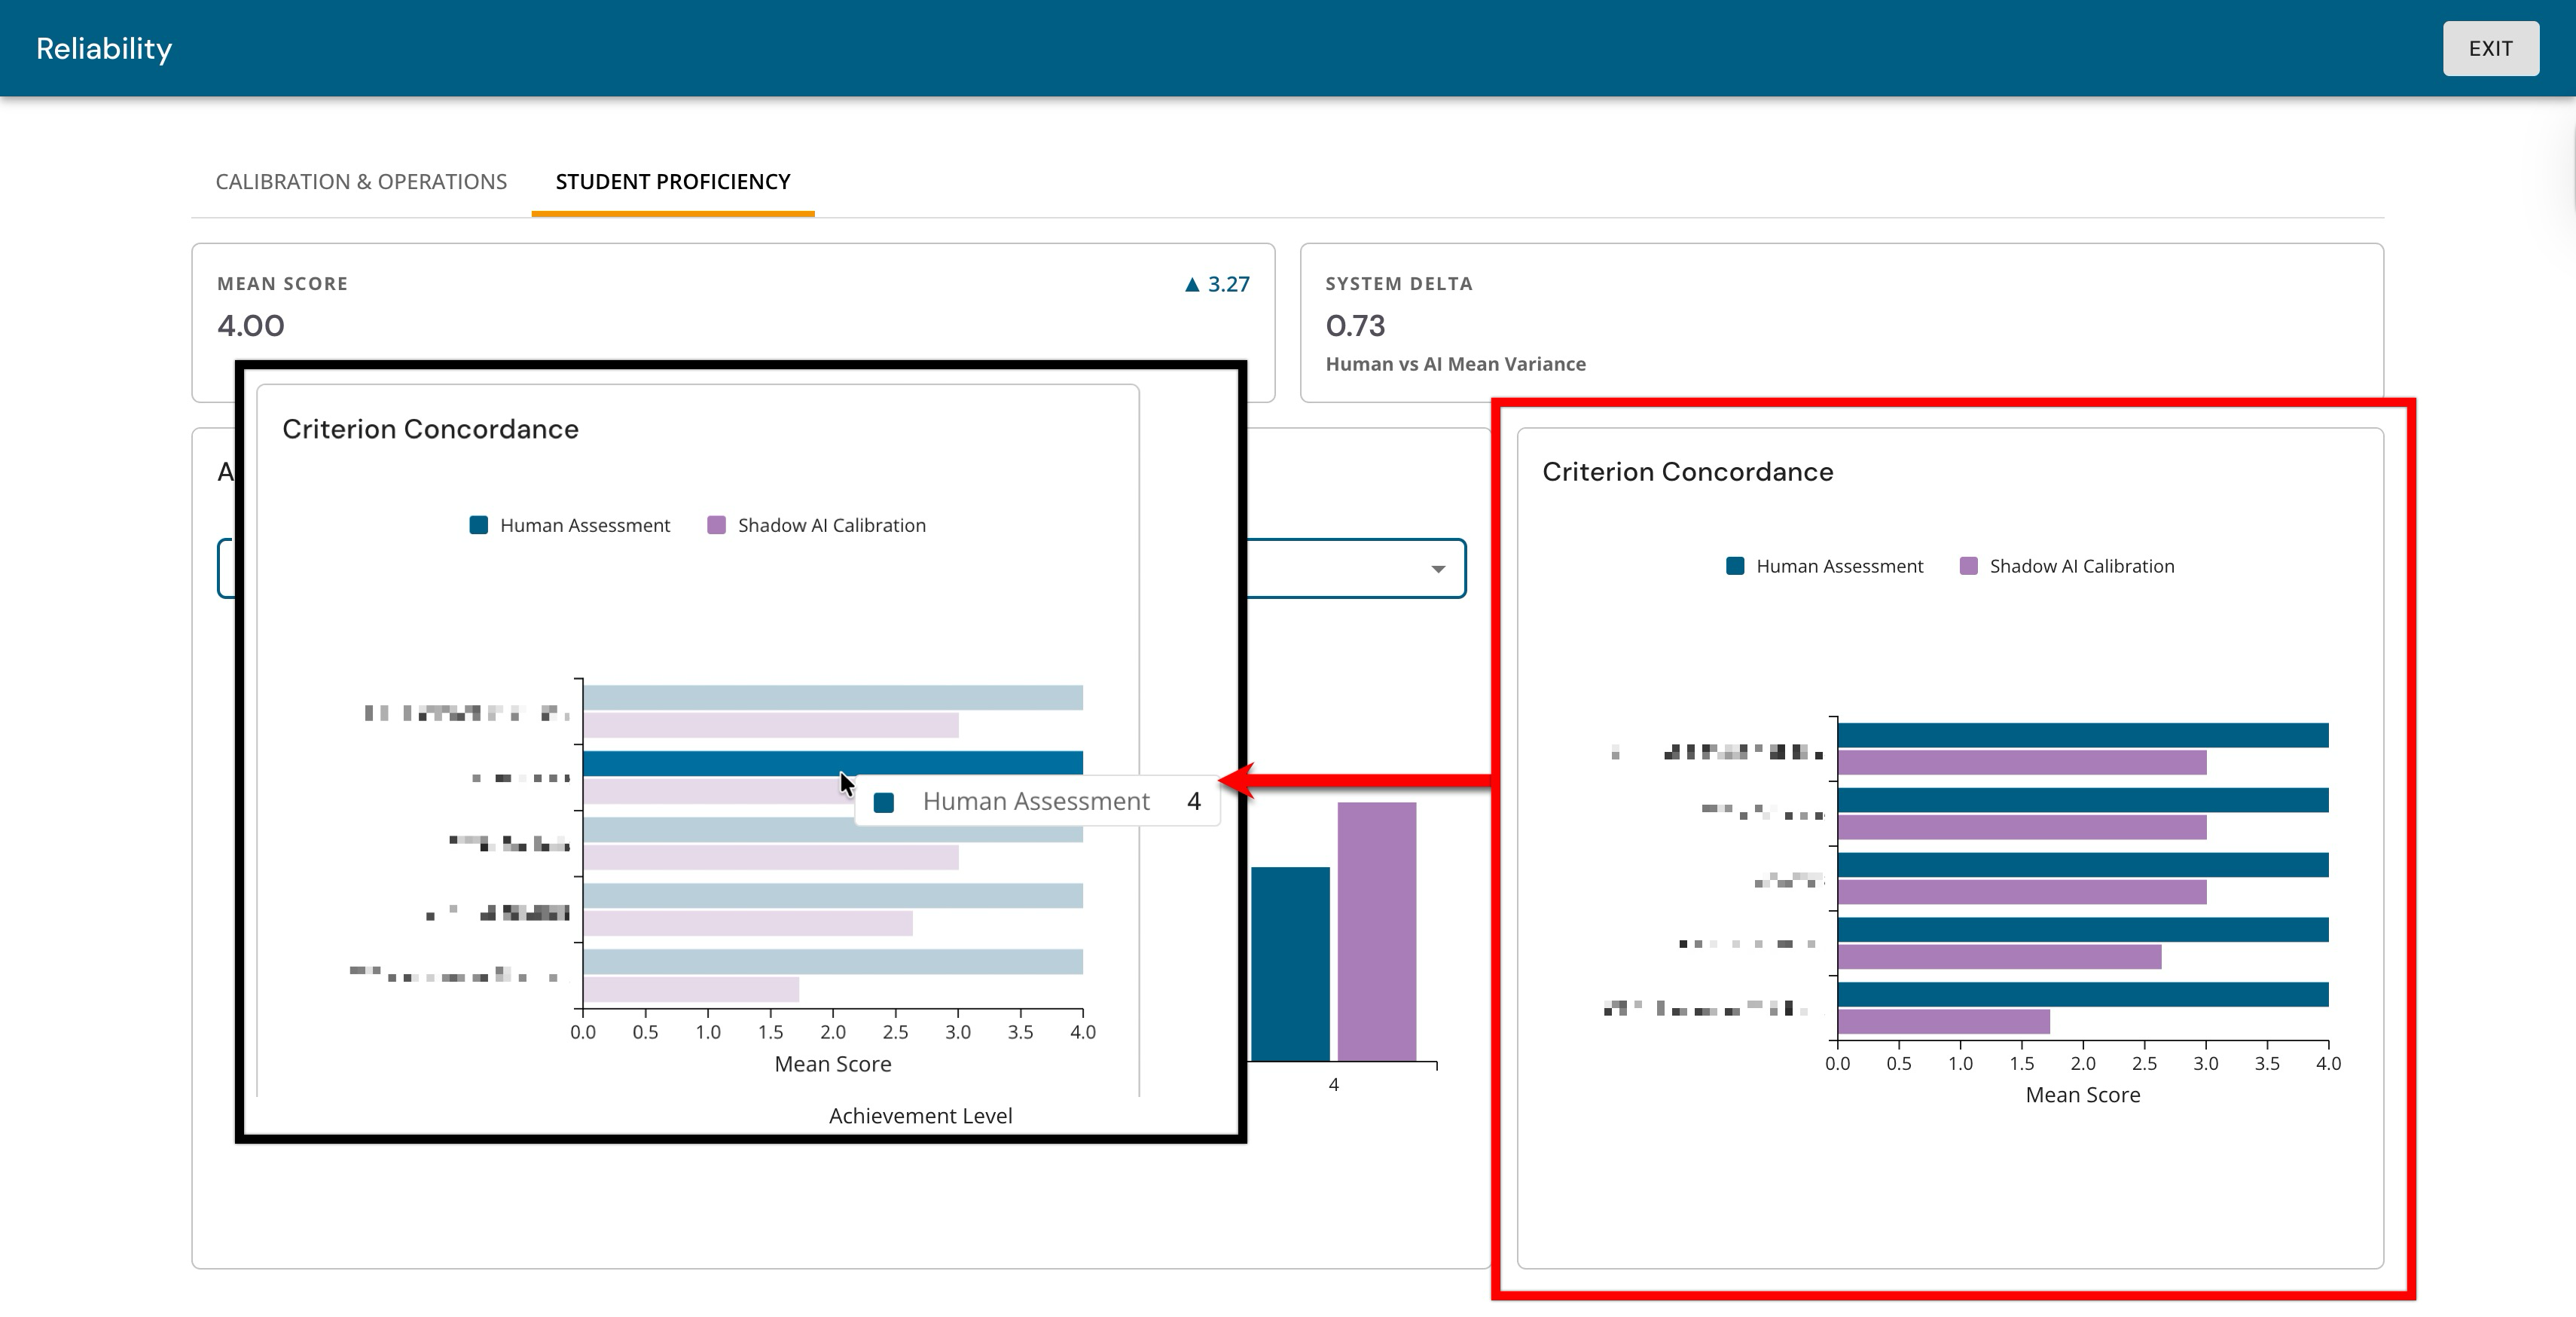
Criteria Concordance
The Criterion Concordance chart answers for each criterion, what is the mean score, and how do assessors and AI compare? Use this chart to quickly identify which criteria to investigate, then use the Achievement Level Distribution chart to understand how scoring differs (e.g., shifted distribution, polarization). Hovering a bar displays the exact mean score value for assessors or the AI Shadow for that criterion.
|
If |
Then |
|---|---|
|
If the blue and purple bars are close in length across most criteria |
Assessors and AI are in general agreement about where performance sits |
|
If there are a few criteria where the bars diverge significantly |
Those are the criteria where the AI and assessors interpret performance differently |