
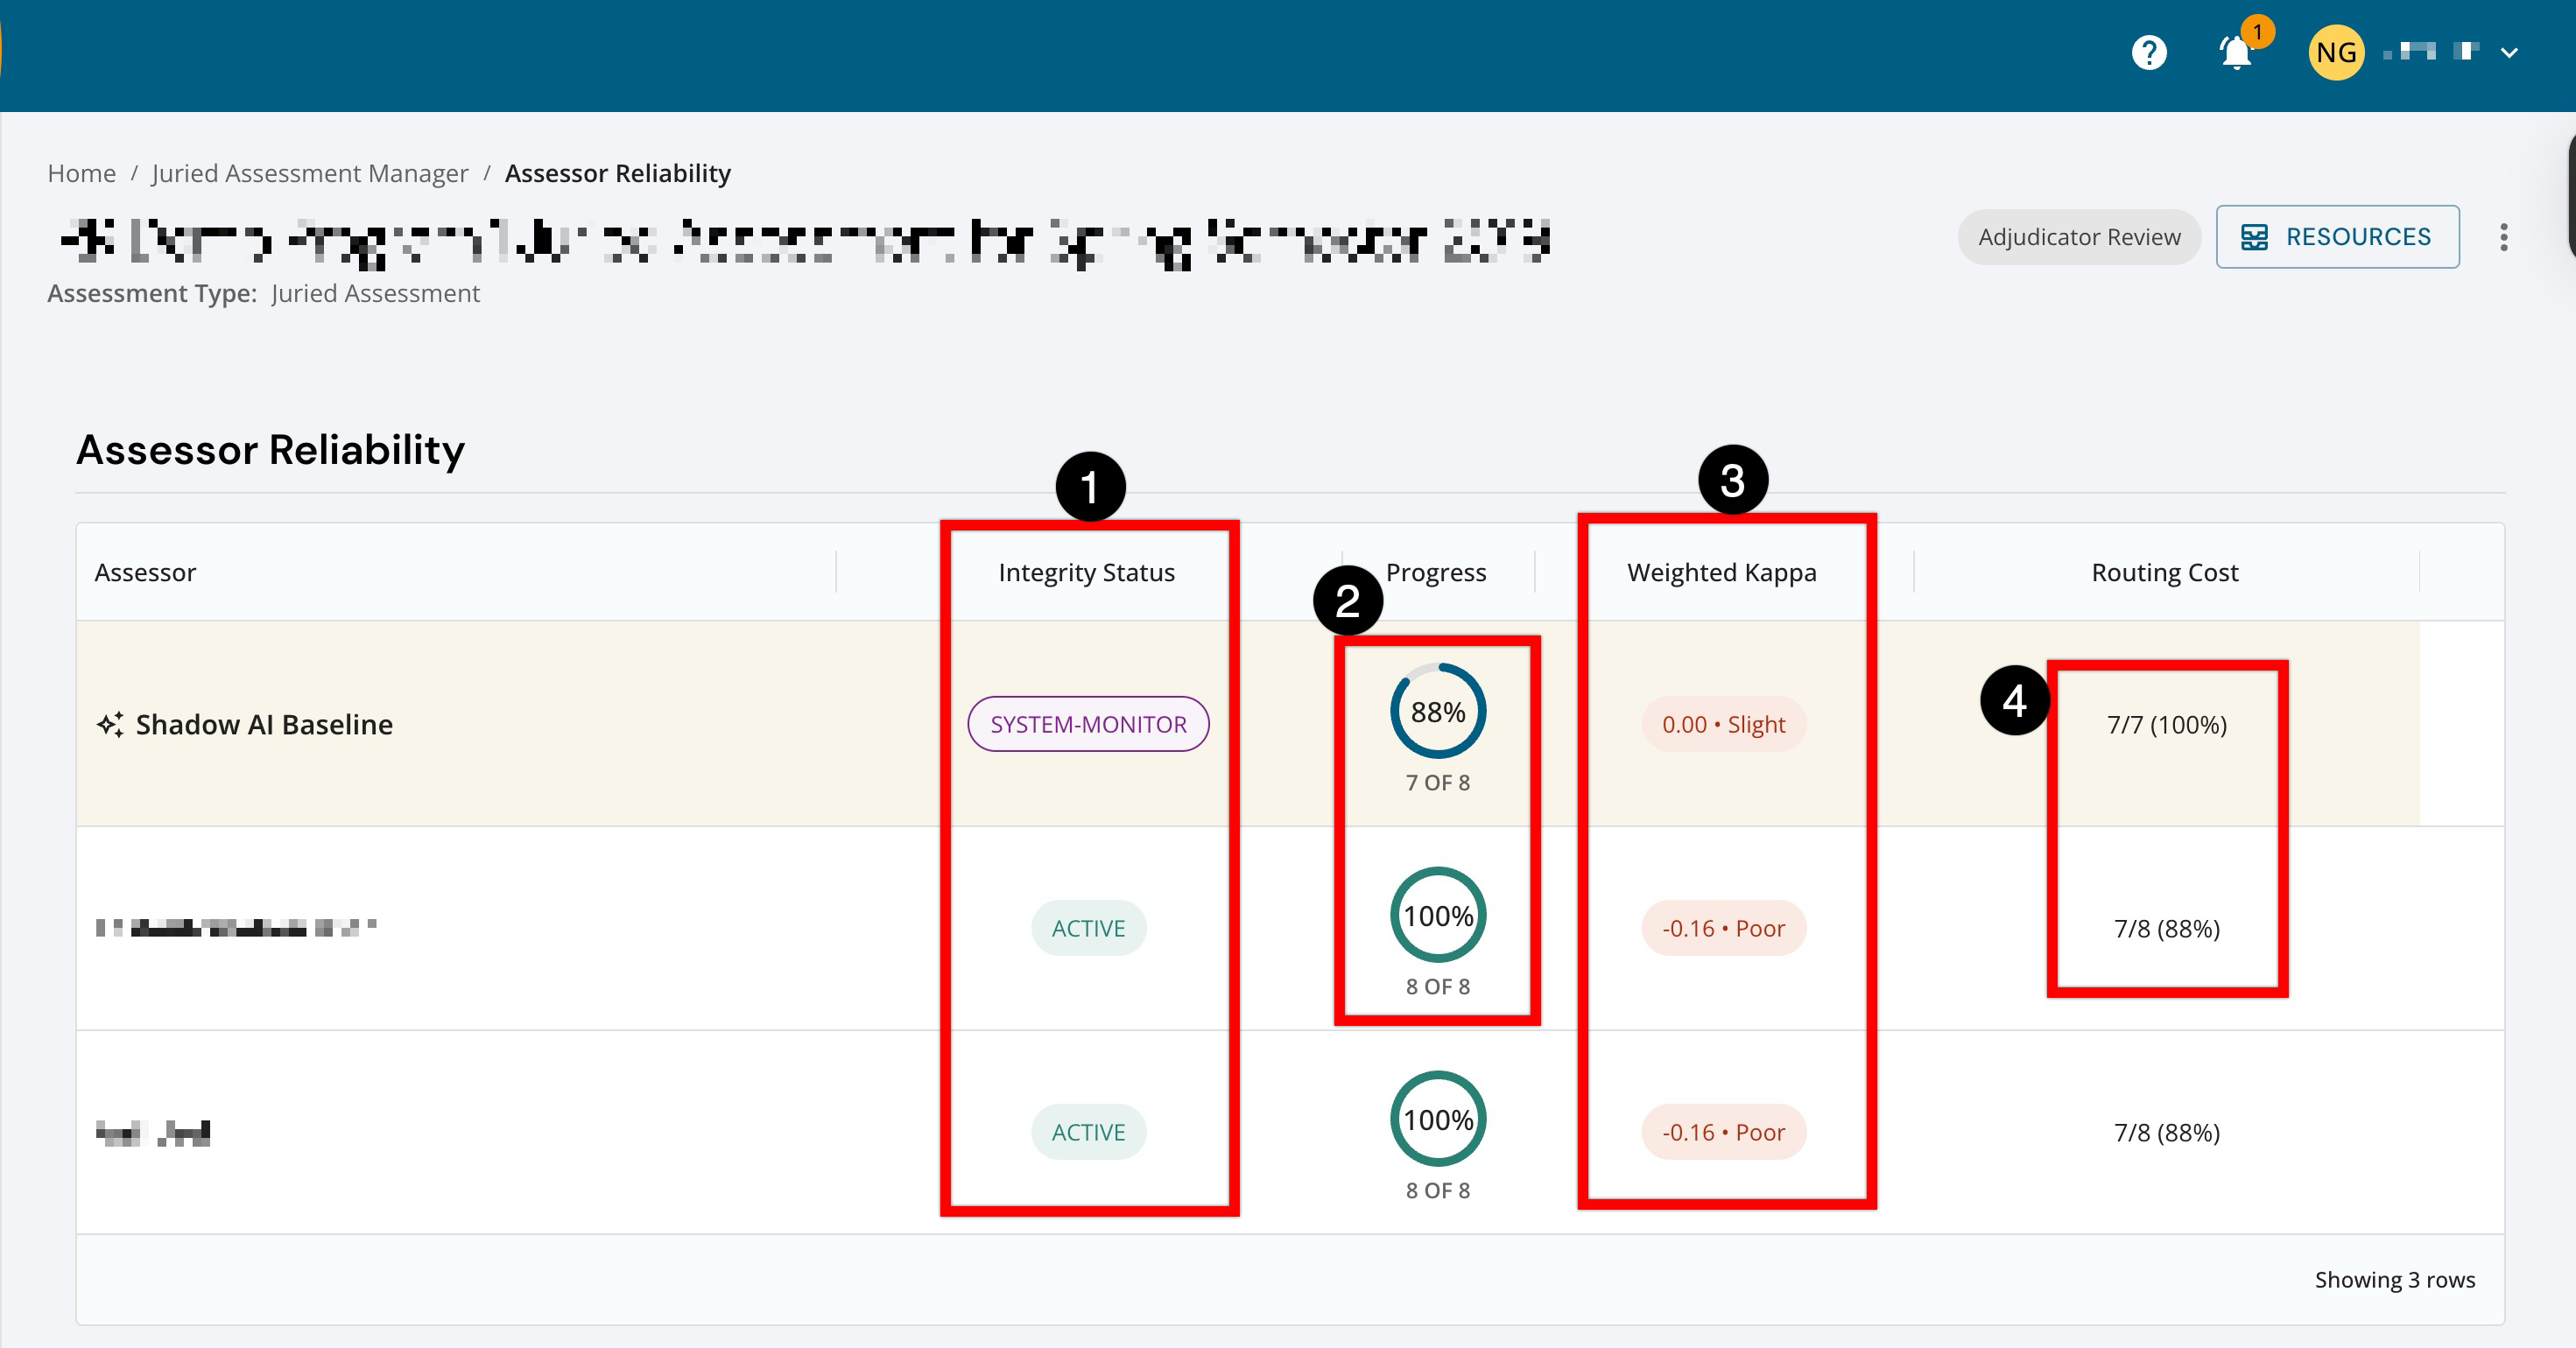
This page monitors how consistently each assessor scores and, when enabled, how the AI shadow baseline compares. This data can help Institutions quickly spot reliability risks and decide whether calibration or intervention is needed. Treat this as a quick monitoring indicator for who is active, and what the AI baseline is vs a person.
|
|
|---|---|
|
1 |
Indicates whether an assessor's scoring activity is flagged for review. Human assessors show Active (scoring normally) and may indicate if they are scoring relatively leniently or strictly compared to other assessors. This status helps coordinators identify assessors who may need to be paused or additional training. |
|
2 |
Shows how far each assessor has gotten through their assigned artifact queue. Displayed as both a percentage and a fraction (e.g., "15 of 41). The visualization makes it easy to spot who's behind or ahead relative to the assessment window. If progress is low, reliability metrics may be unstable or not yet very meaningful. If progress is near 100%, the reliability signals are more representative of how that assessor is actually scoring. |
|
3 |
The inter-rater reliability (IRR) statistic measures how consistently each Assessor scores relative to the panel. A higher weighted kappa indicates stronger agreement. Negative values are a strong warning sign: they usually mean the scoring pattern is inconsistent enough that agreement is worse than chance (i.e., a clear reliability issue). |
|
4 |
This shows a workload/volume indicator related to how much scoring activity is associated with that Assessor. This tracks how many artifacts have been rerouted to additional Assessors due to scoring discrepancies, expressed as a count and percentage of total (e.g., "0/15 (0%)"). High routing cost signals reliability problems, driving extra work and potential delays. This can be used alongside the Progress column to understand whether an Assessor is keeping up with their assigned scoring volume. If routing cost is lagging, it may indicate a bottleneck that could affect the reliability because fewer completed scores mean fewer stable comparisons. |