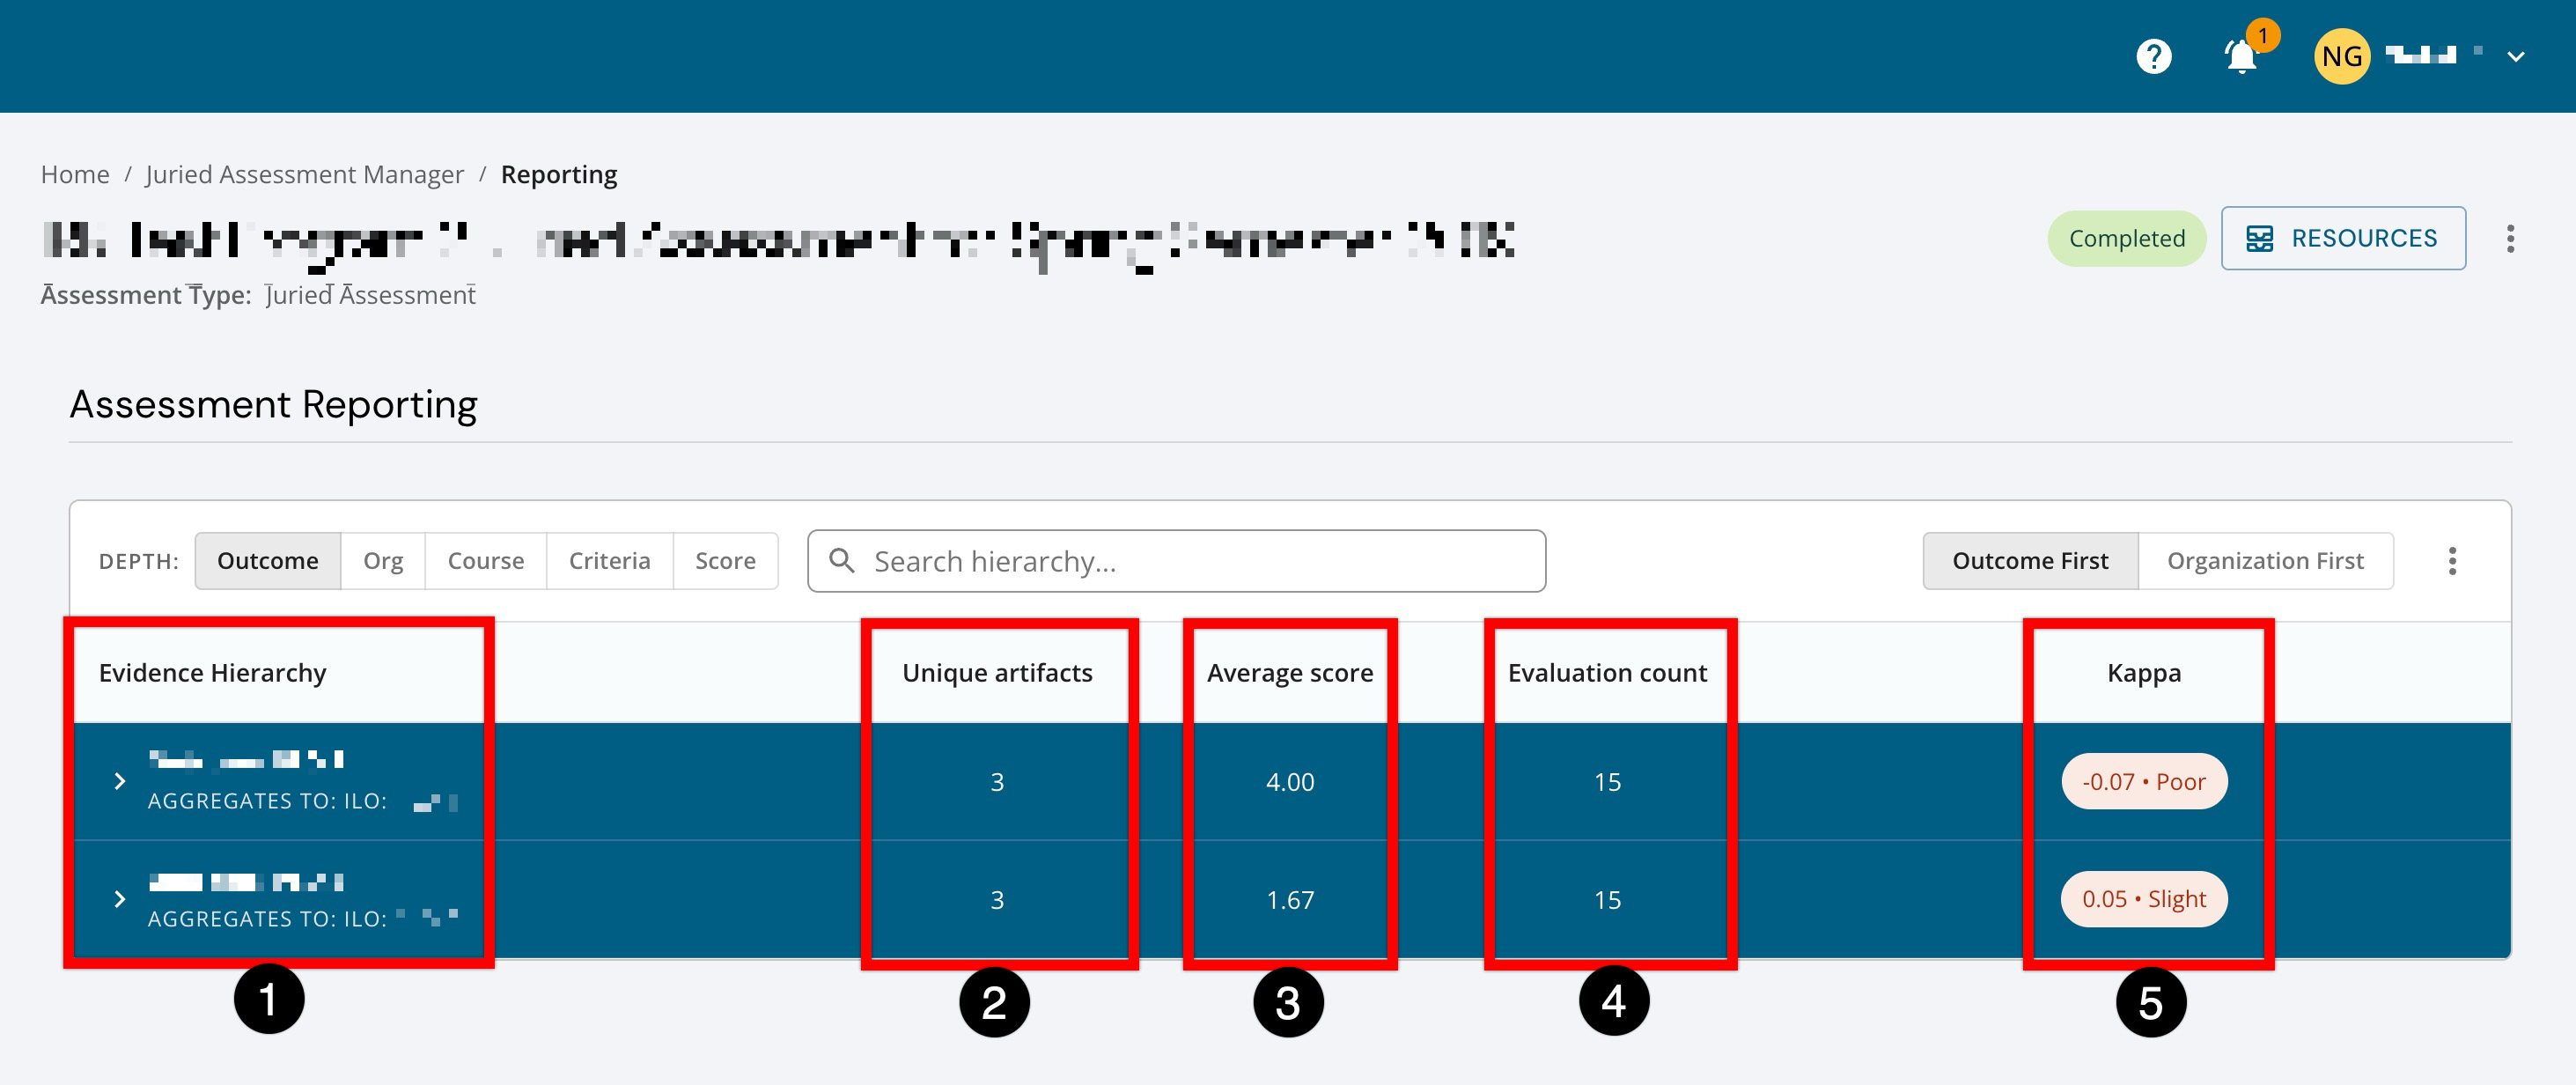
The Reporting page provides a rollup view of Juried Assessment scoring results across the evidence hierarchy, helping interpret performance and reliability without pulling raw scoring exports. The controls are meant to help change the display (how detailed it is, what grouping, hierarchy level , et.c), while the table columns summarize how much evidence is included in each rollup and what that evidence suggests. By default the view is configured to display the outcome level with all rows collapsed.
|
|
|---|---|
|
1 |
Shows what each row of results is summarizing, and is also the control used to drill down (or roll up) through the levels of evidence. |
|
2 |
Indicates how many distinct student artifacts are included in that row’s summary, |
|
3 |
Provides a quick overall performance score. This becomes most meaningful when interpreted alongside deeper drill-downs that show how that average was produced. |
|
4 |
Reflects how many scoring evaluations contributed; this count is often higher than unique artifacts when multiple assessors score the same artifact. |
|
5 |
This is a reliability lens that indicates how consistently Assessors agree at that level. Higher values generally indicate stronger agreement, while lower values may signal disagreement, ambiguous rubric guidance, calibration needs, or other scoring complexities that warrant closer review. |
Changing The Display
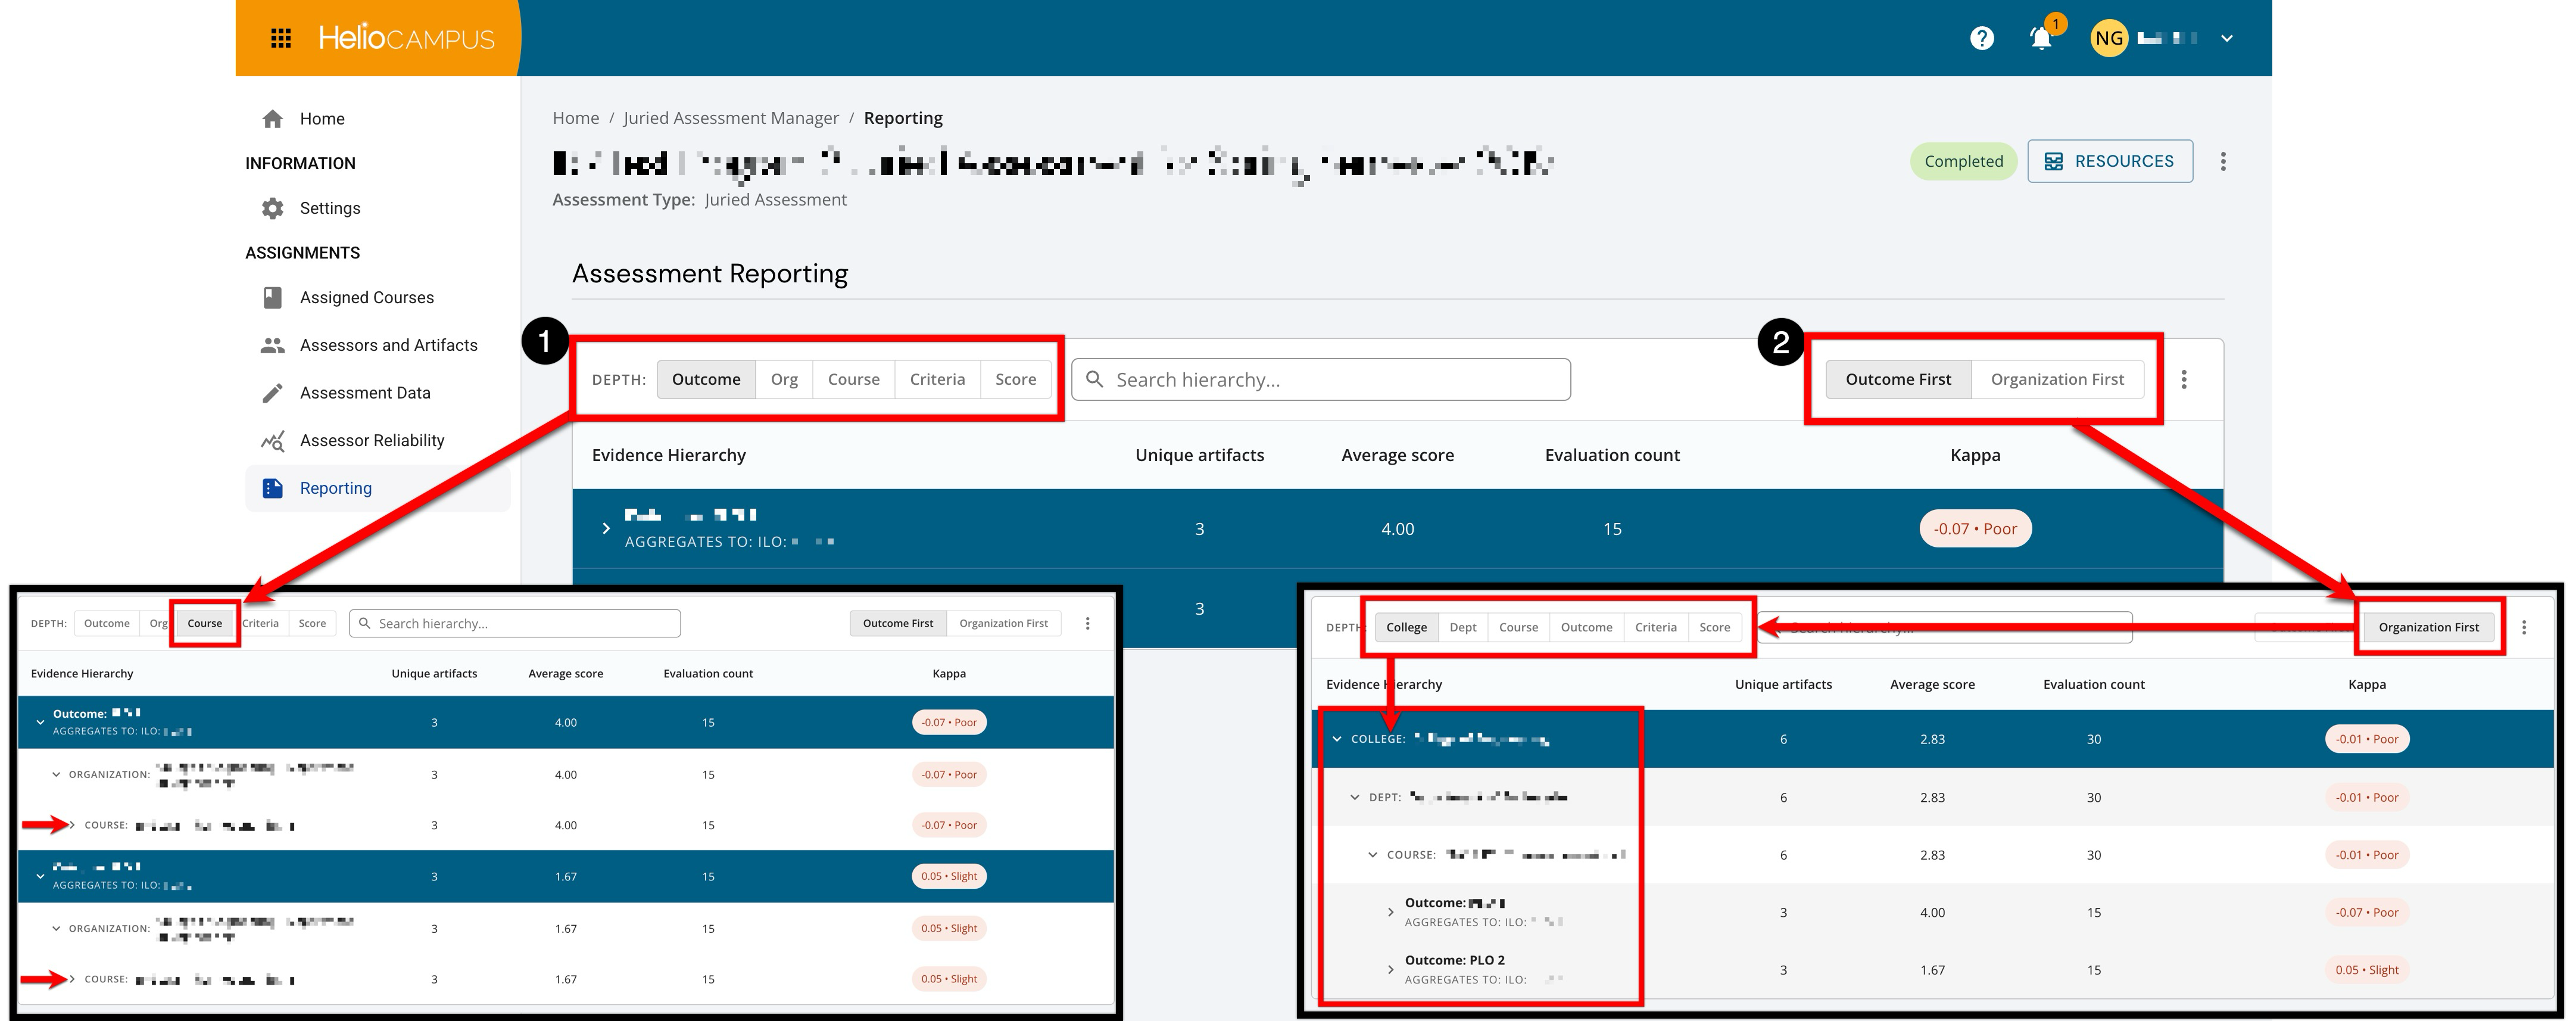
The Depth selector (1) chooses how deep the hierarchy expands in the results table. Selecting a shallower depth reveals tiers beneath each row to see from broad results down to the level where scoring patterns and rubric performance become clear. In practice, this means users can start with an overview and progressively increase the level of detail to narrow in on where questions or issues arise. On the right, the outcome and organization toggles (2) changes the orientation of the view, essentially deciding what appears at the top of the list. The underlying data is the same; the toggle simply provides the most natural navigation depending on how results need to be analyzed.
-
Outcome First: Starts from outcomes and nests the organizational and instructional levels underneath, which is useful when the primary question is “How did we do on each outcome?”.
-
Organization First: Starts with the organizational structure and nests outcomes beneath it, which is useful when the primary question is “How is a specific unit performing, and on which outcomes?”.
Drilling Down
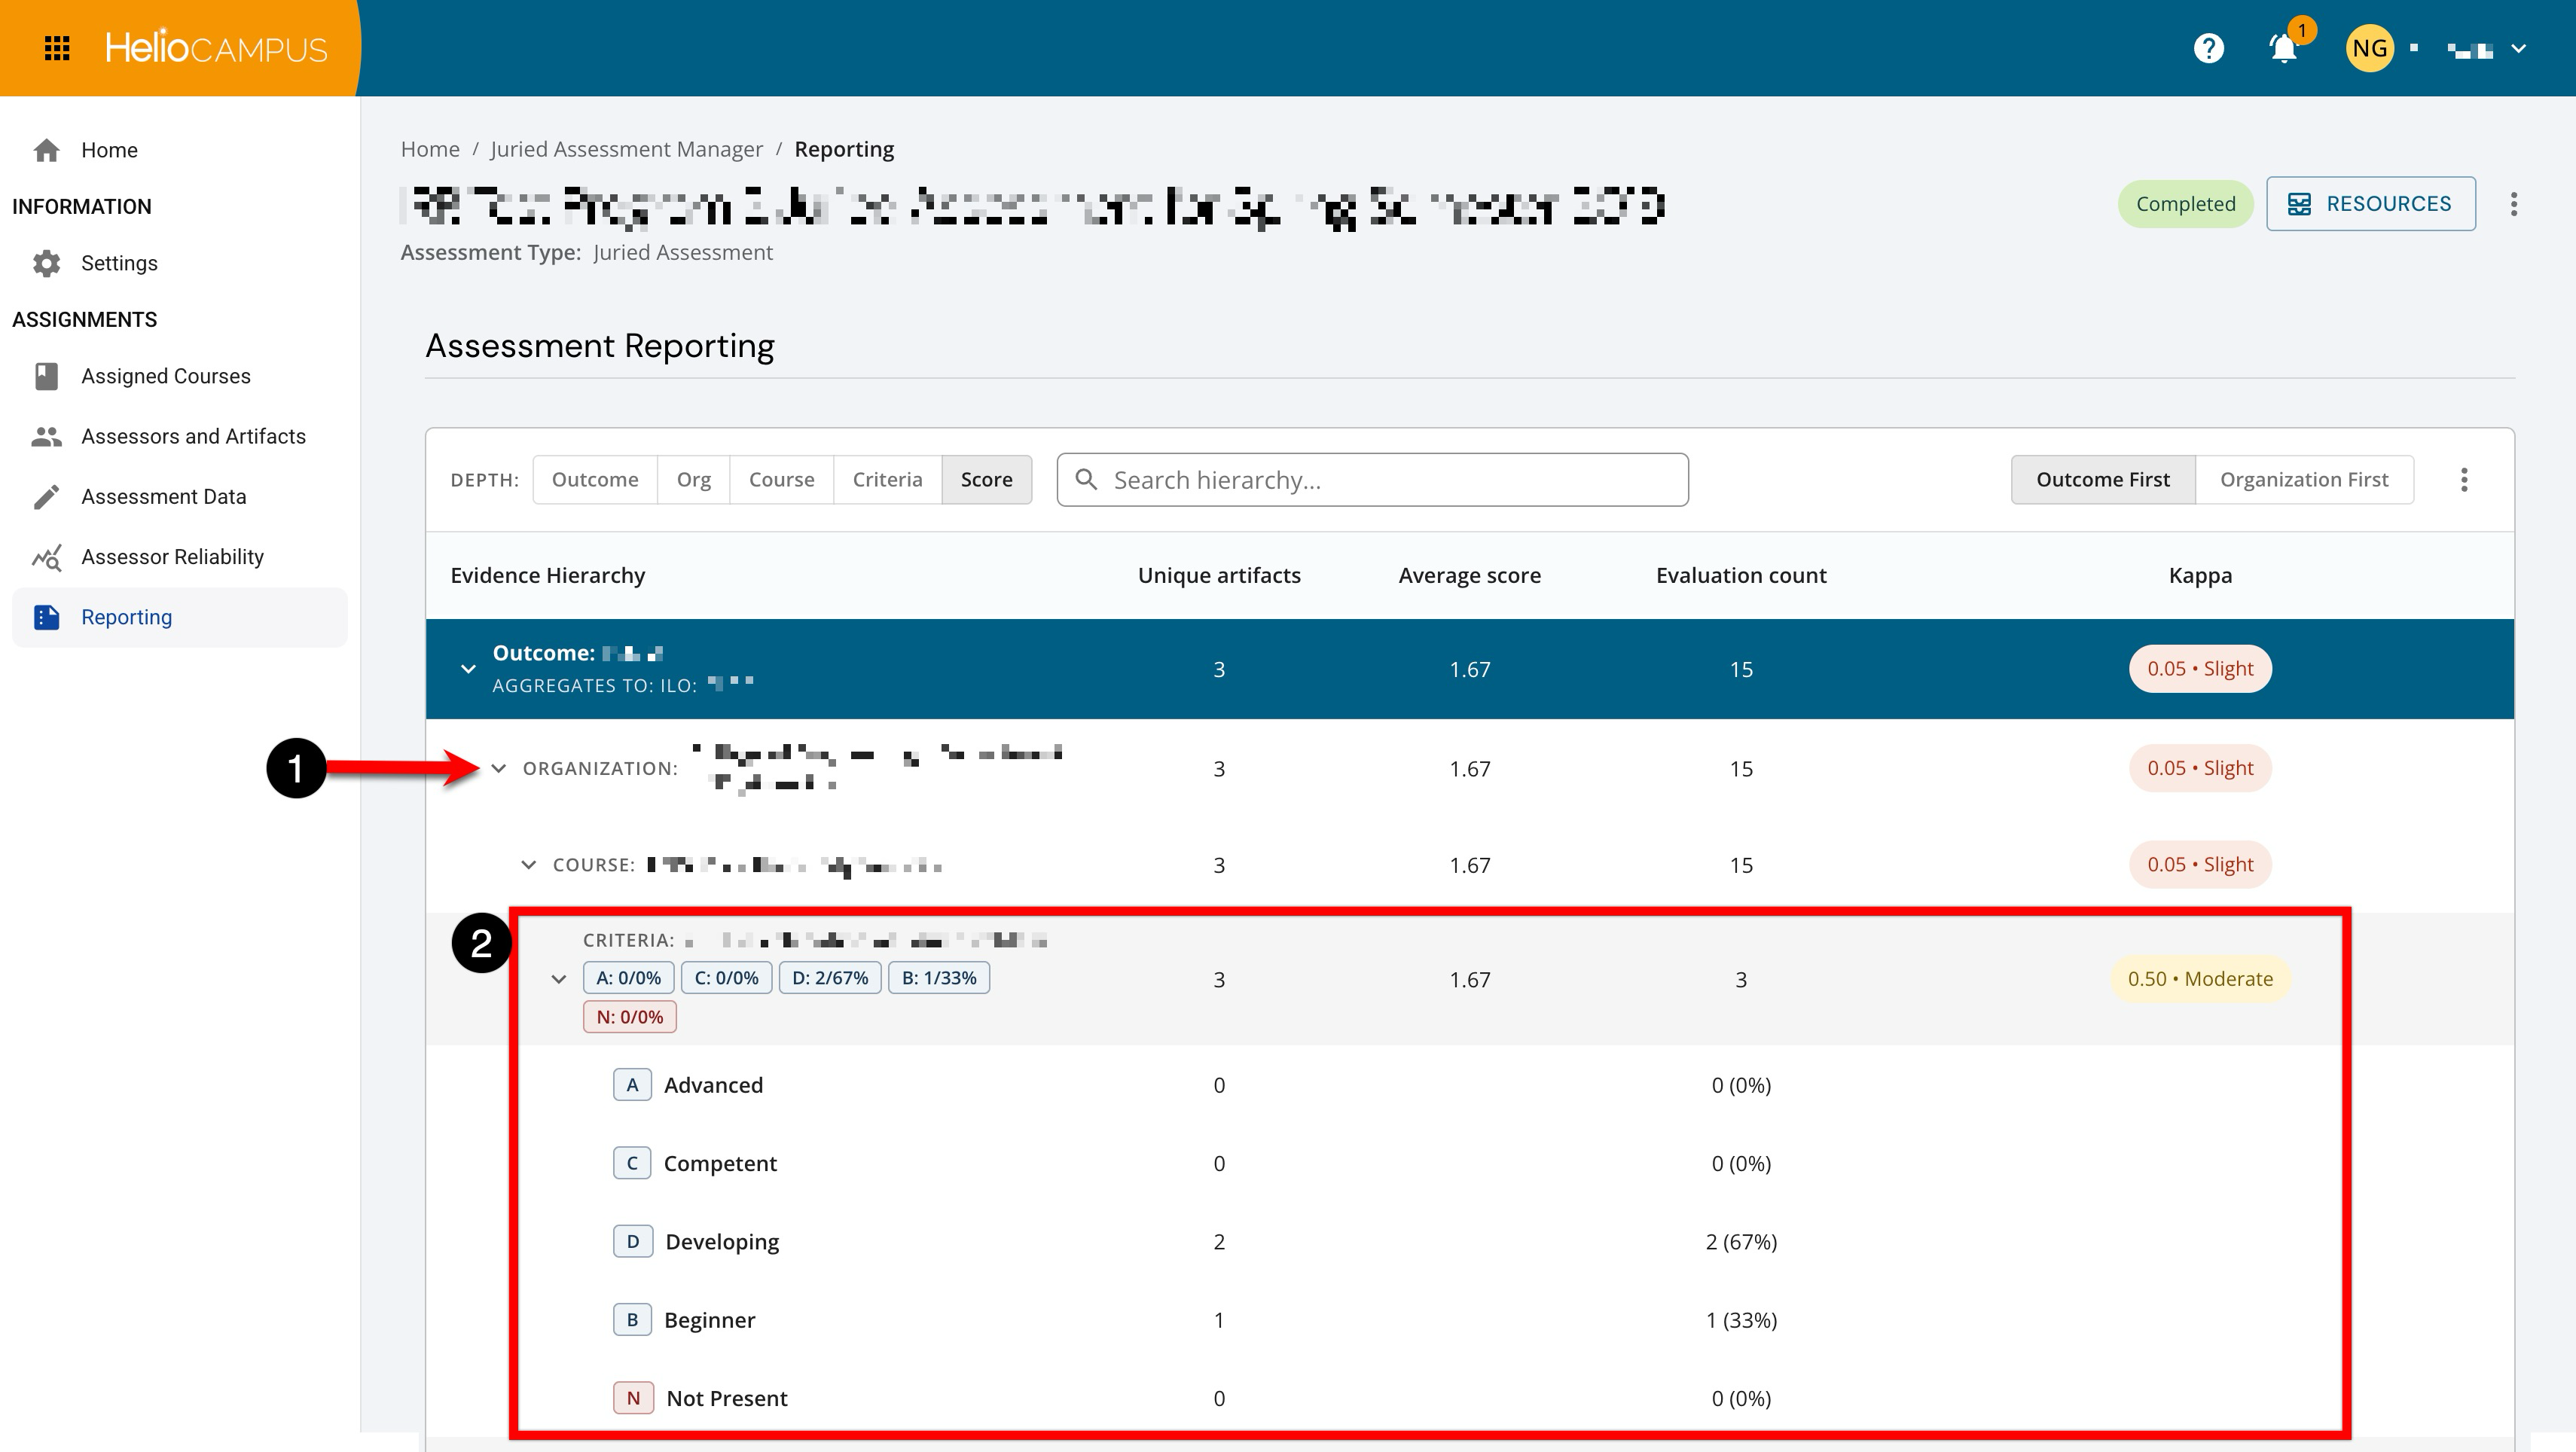
Regardless of the depth or orientation, expanding the levels allows for drill-down (1). When drilling down to view detailed data (especially at the score level), the table displays score distribution information (2) that breaks results into achievement levels (for example, showing how many ratings fell into each level, such as Advanced/Competent/Developing/Beginner/Not Present). This distribution view is important because two criteria can have the same average score yet very different underlying patterns—one might be consistently “middle,” while the other might be split between high and low ratings. A common workflow is to begin with a high-level view, scan for surprising averages or low Kappa, and then drill down until the specific course/criterion/score distribution explains what’s happening and where follow-up is needed.
Exporting Scoring Ledger
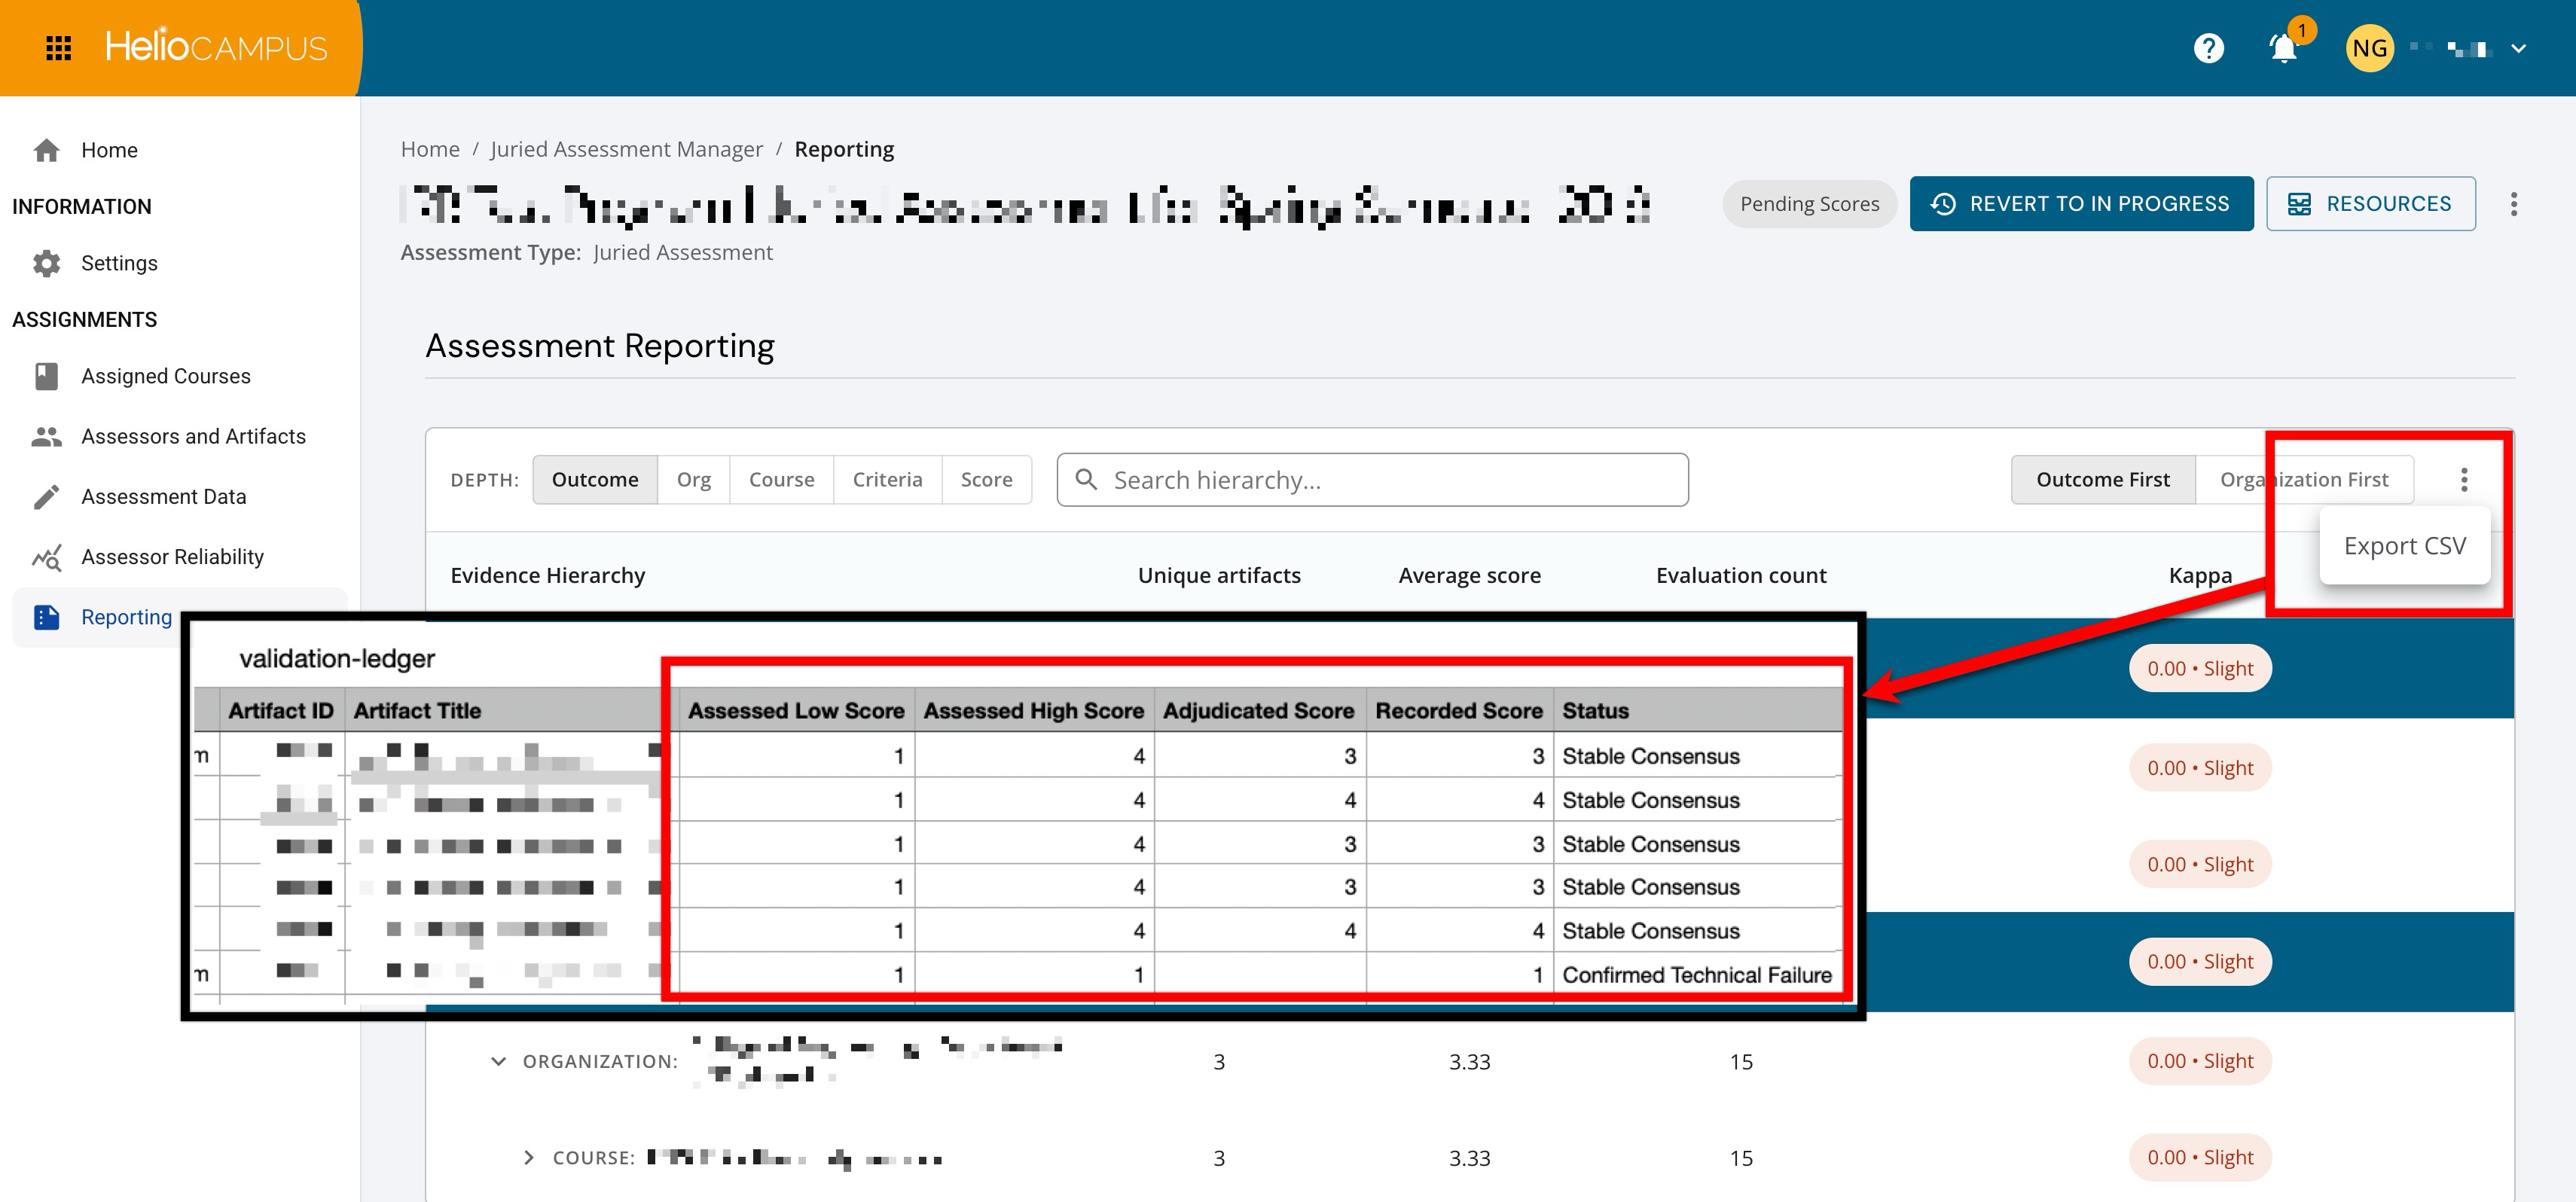
The reporting CSV is available only when Interrater Reliability (IRR) is enabled via the assessment Settings page.
The scoring ledger provides a comprehensive artifact-level view of all scoring and validation data, making it easier to analyze inter-rater agreement, verify adjudication outcomes, and support accreditation reporting without manual data compilation. The ledger can be accessed by expanding the More Actions menu and selecting Export CSV. The exported ledger contains one row per artifact-criteria pair. Each row reflects the current validation state of the scored artifact in the Status column:
-
Stable Consensus: When evaluators agreed on the performance level.
-
Discordant Value Identified: When the spread between assessed scores requires adjudication.
-
Confirmed Technical Failure: When a valid score could not be recorded.