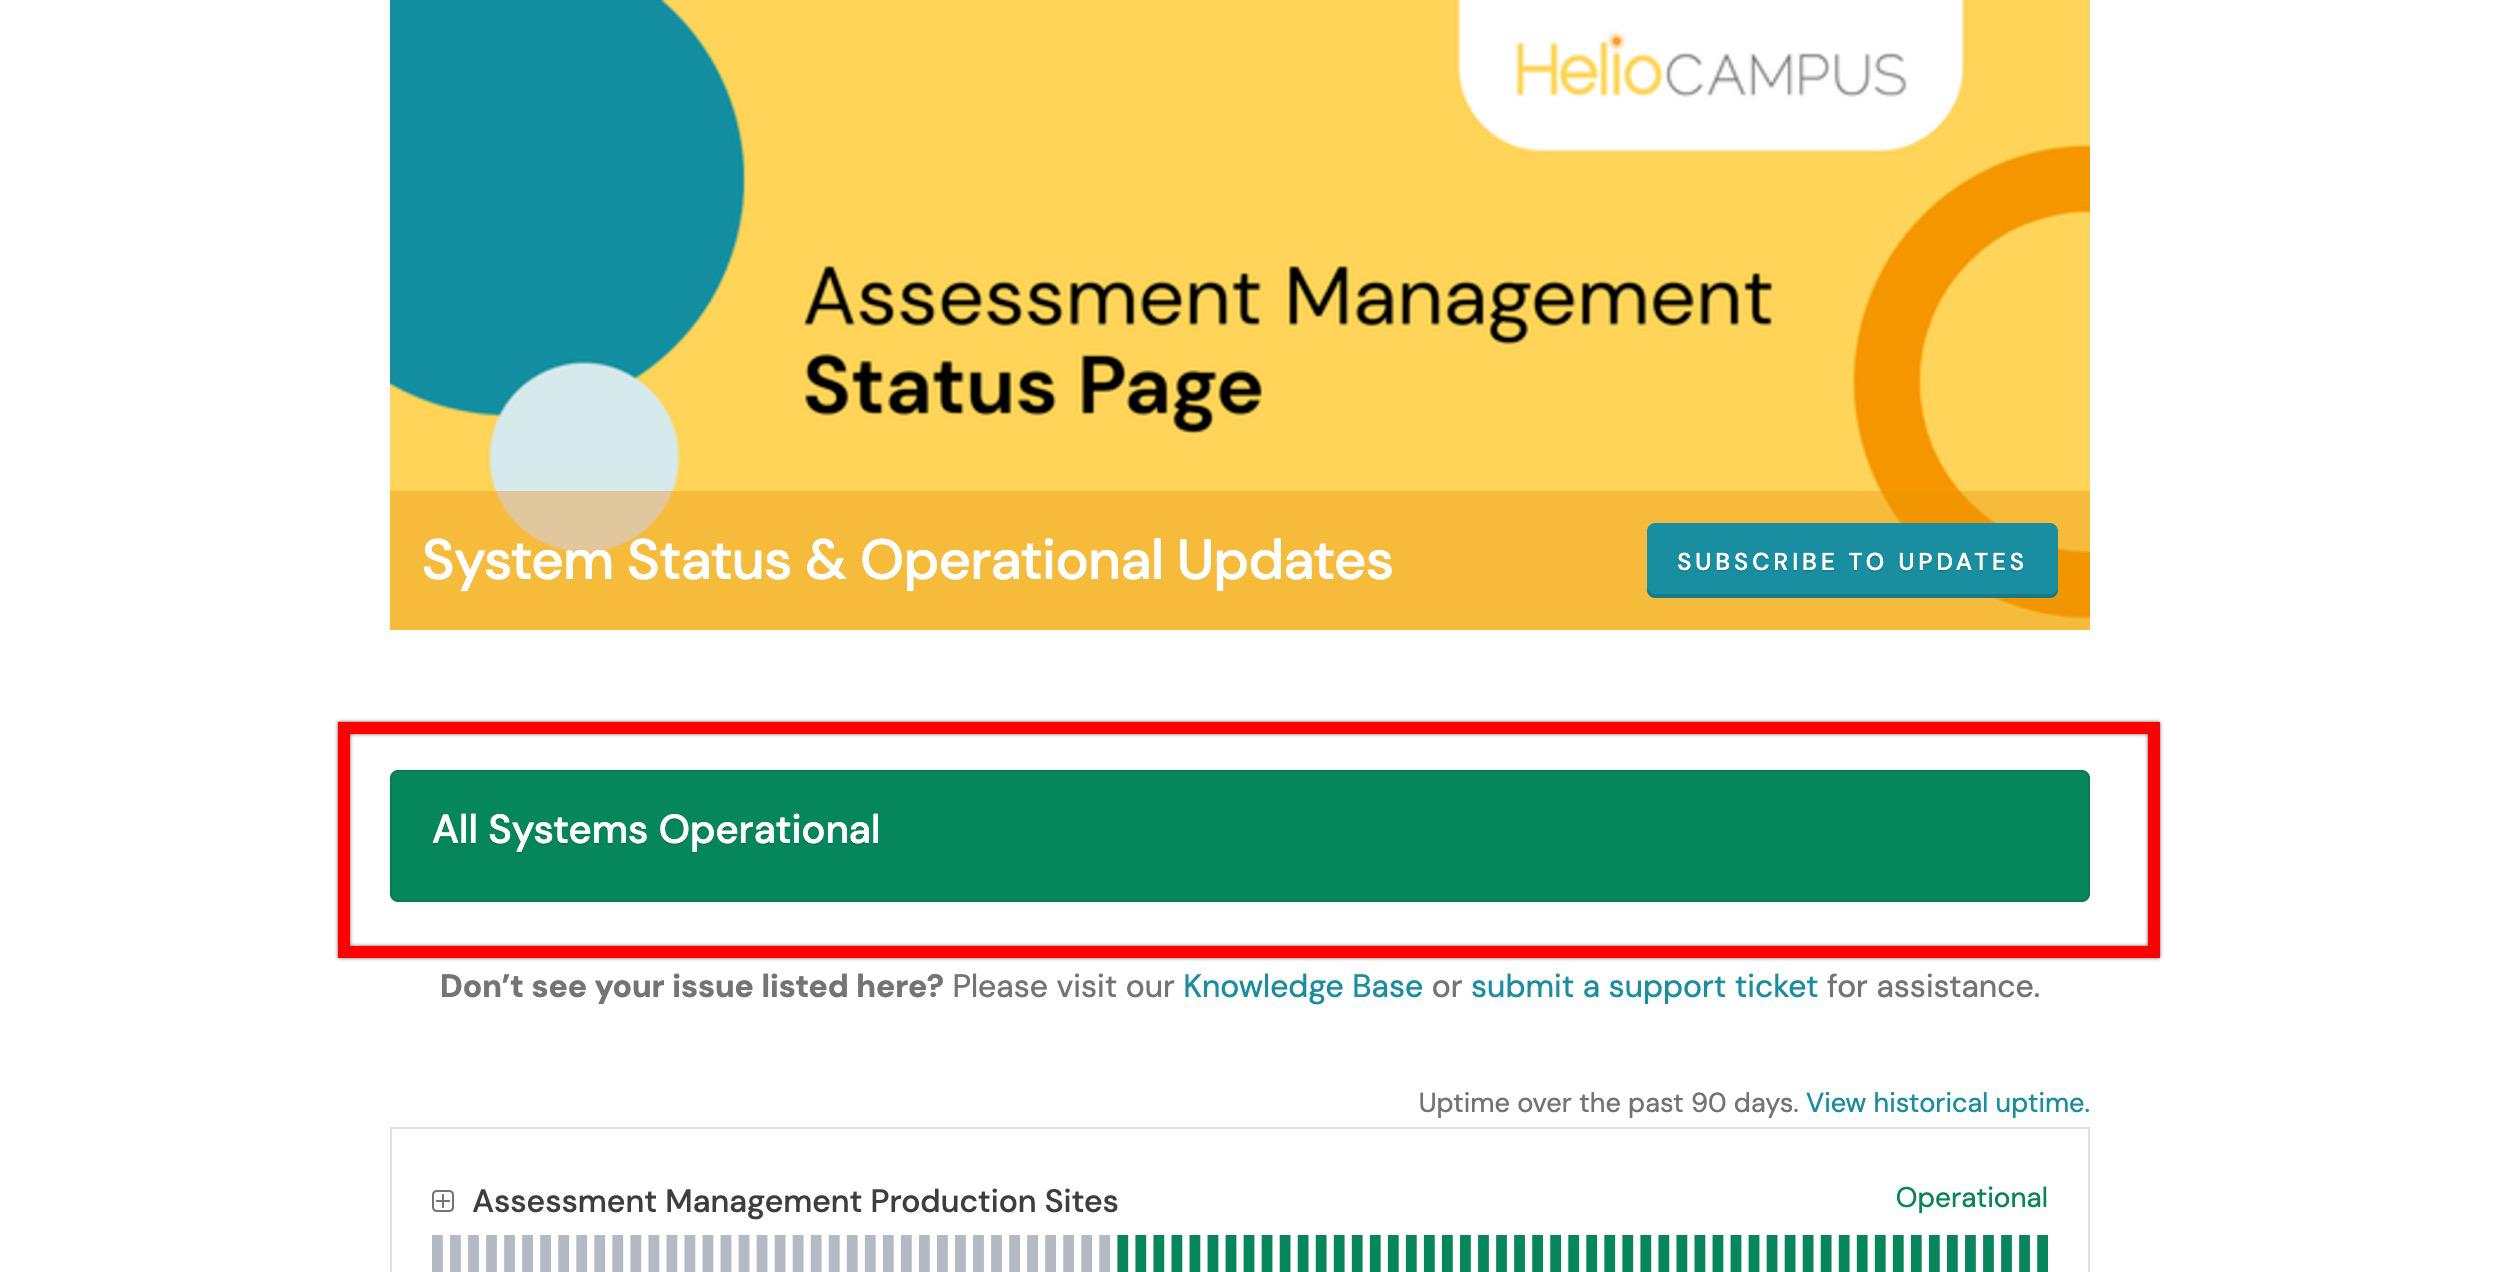
The Assessment Management Status Page requires no login to see real-time health updates of platform components. Use this page to quickly determine whether a problem is a known platform issue or something specific to the Institution account. The banner at the top of the page provides an immediate summary of the platform's current health. It reflects the status across all monitored components, even if only one component is affected.
Monitored Components
The status page tracks the following platform components individually. Users experiencing a specific issue should check the relevant component rather than relying solely on the overall banner. If the status page shows all systems operational, but an issue is present, the issue may be specific to an Institution's environment.
|
Component |
Description |
|
Assessment Management Production Sites |
Monitors the overall health of the production platform. |
|
Site Access and Performance |
Monitors user access to the platform and overall site performance, including login, page loading, and general usability. |
|
Background Processing |
Monitors the background platform automation that supports system updates and notifications. Issues may result in the delayed processing of automated tasks across the platform. |
|
Data Imports |
Backend service that consumes the data files needed to use the HelioCampus Assessment Management platform |
|
Assessment Management Training Sites |
Monitors user access to the training platform and overall site performance, including login, page loading, and general usability. |
|
Assessment Assistant AI Bot |
Monitors the AI chatbot used for both the Knowledge Base and the help section in the Assessment Management platform |
Interpreting The Status Page
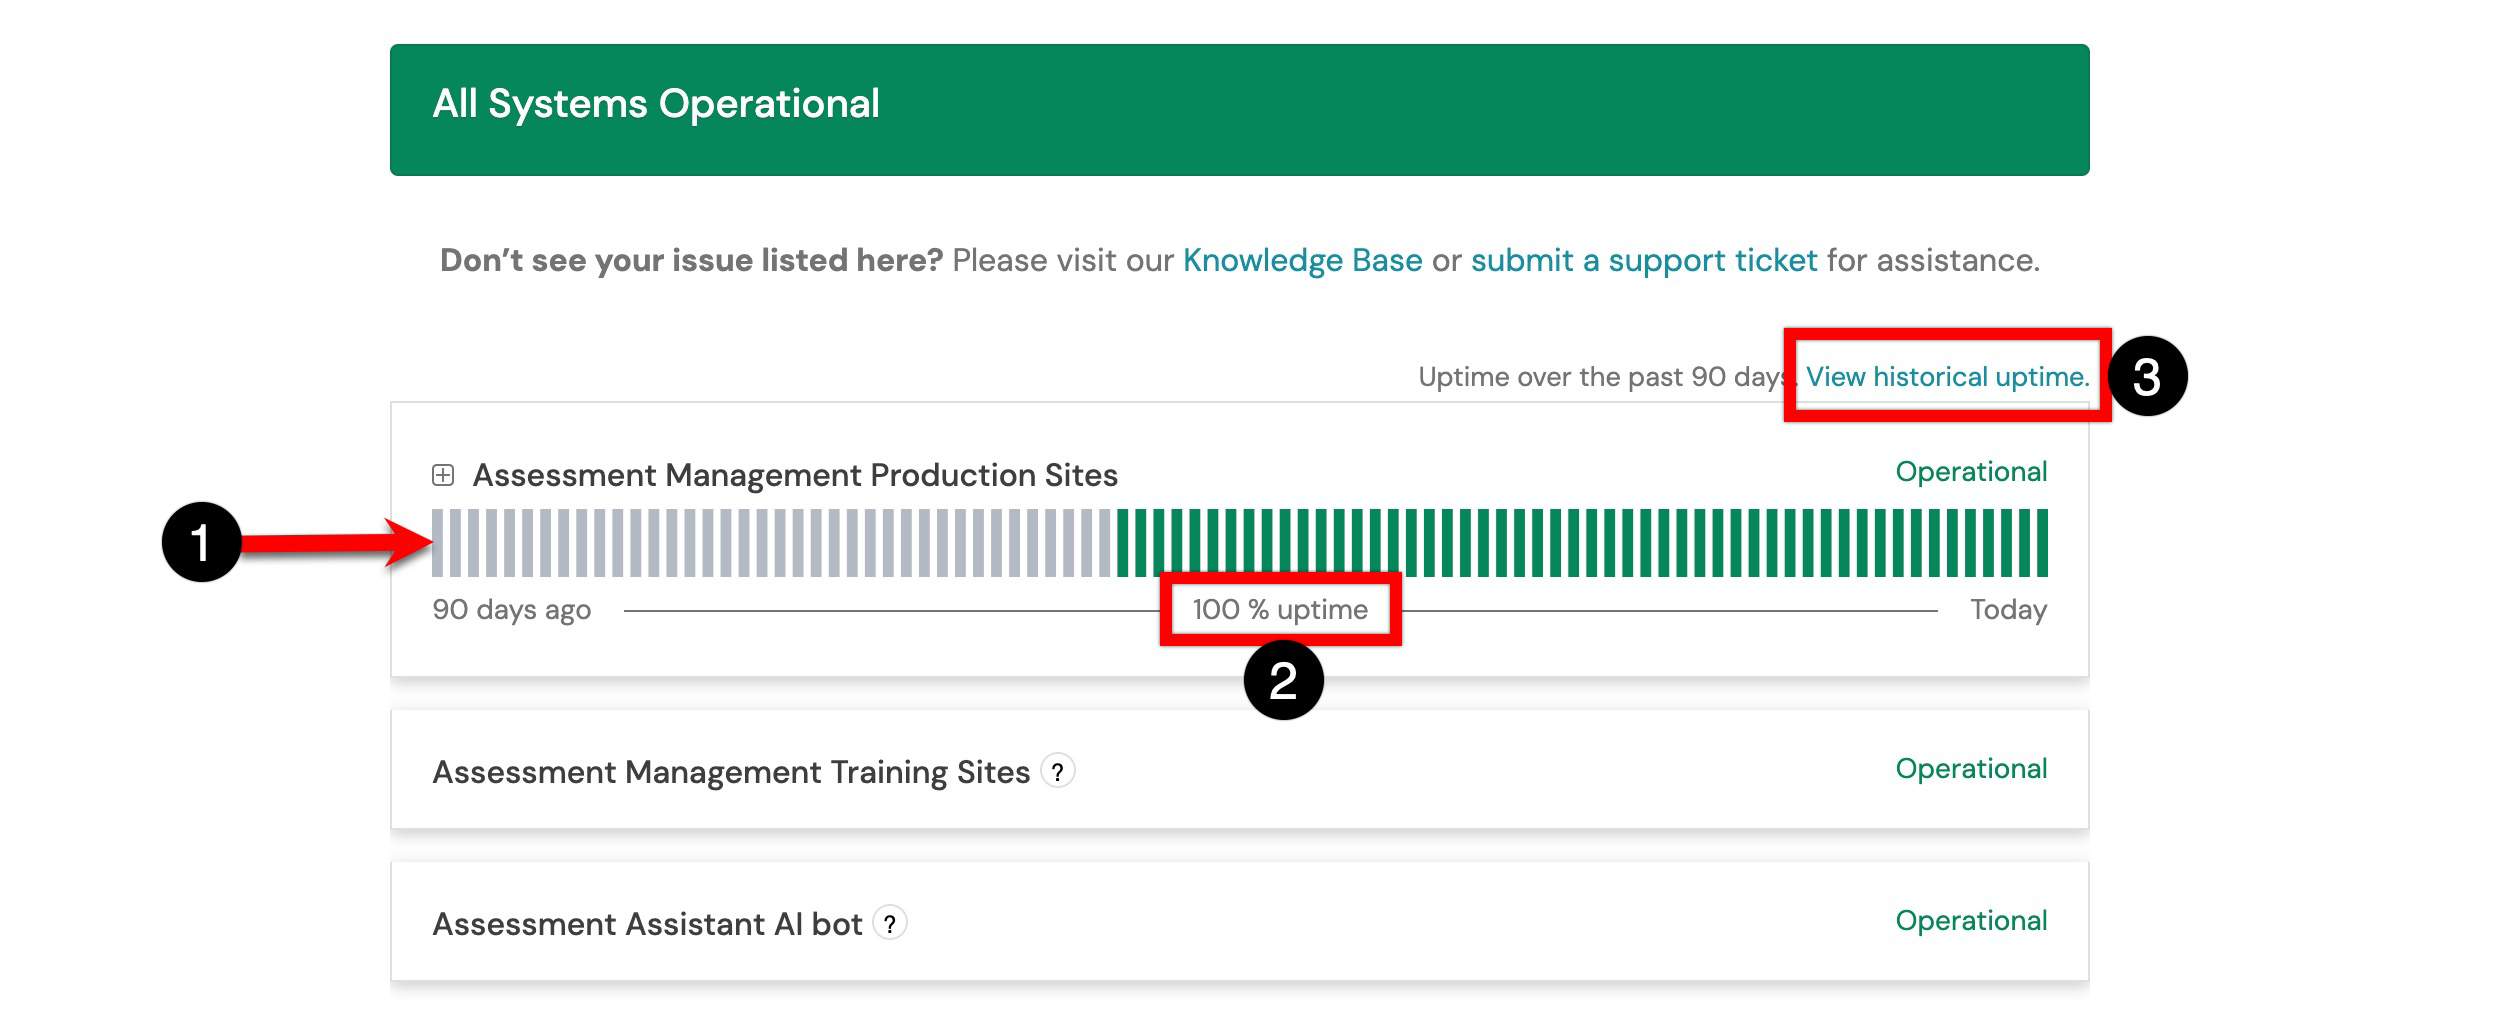
A horizontal bar shows uptime over the past 90 days (1), with each segment representing one calendar day. A percentage figure beneath the bar (2) summarizes uptime across the full 90-day window. Selecting View historical uptime (3) will display a detailed breakdown of platform status by date.
-
Green: Fully operational that day.
-
Yellow or Orange: Degraded performance or partial outage.
-
Red: Major outage recorded.
-
Gray: No data recorded for that day (this does not indicate an outage).
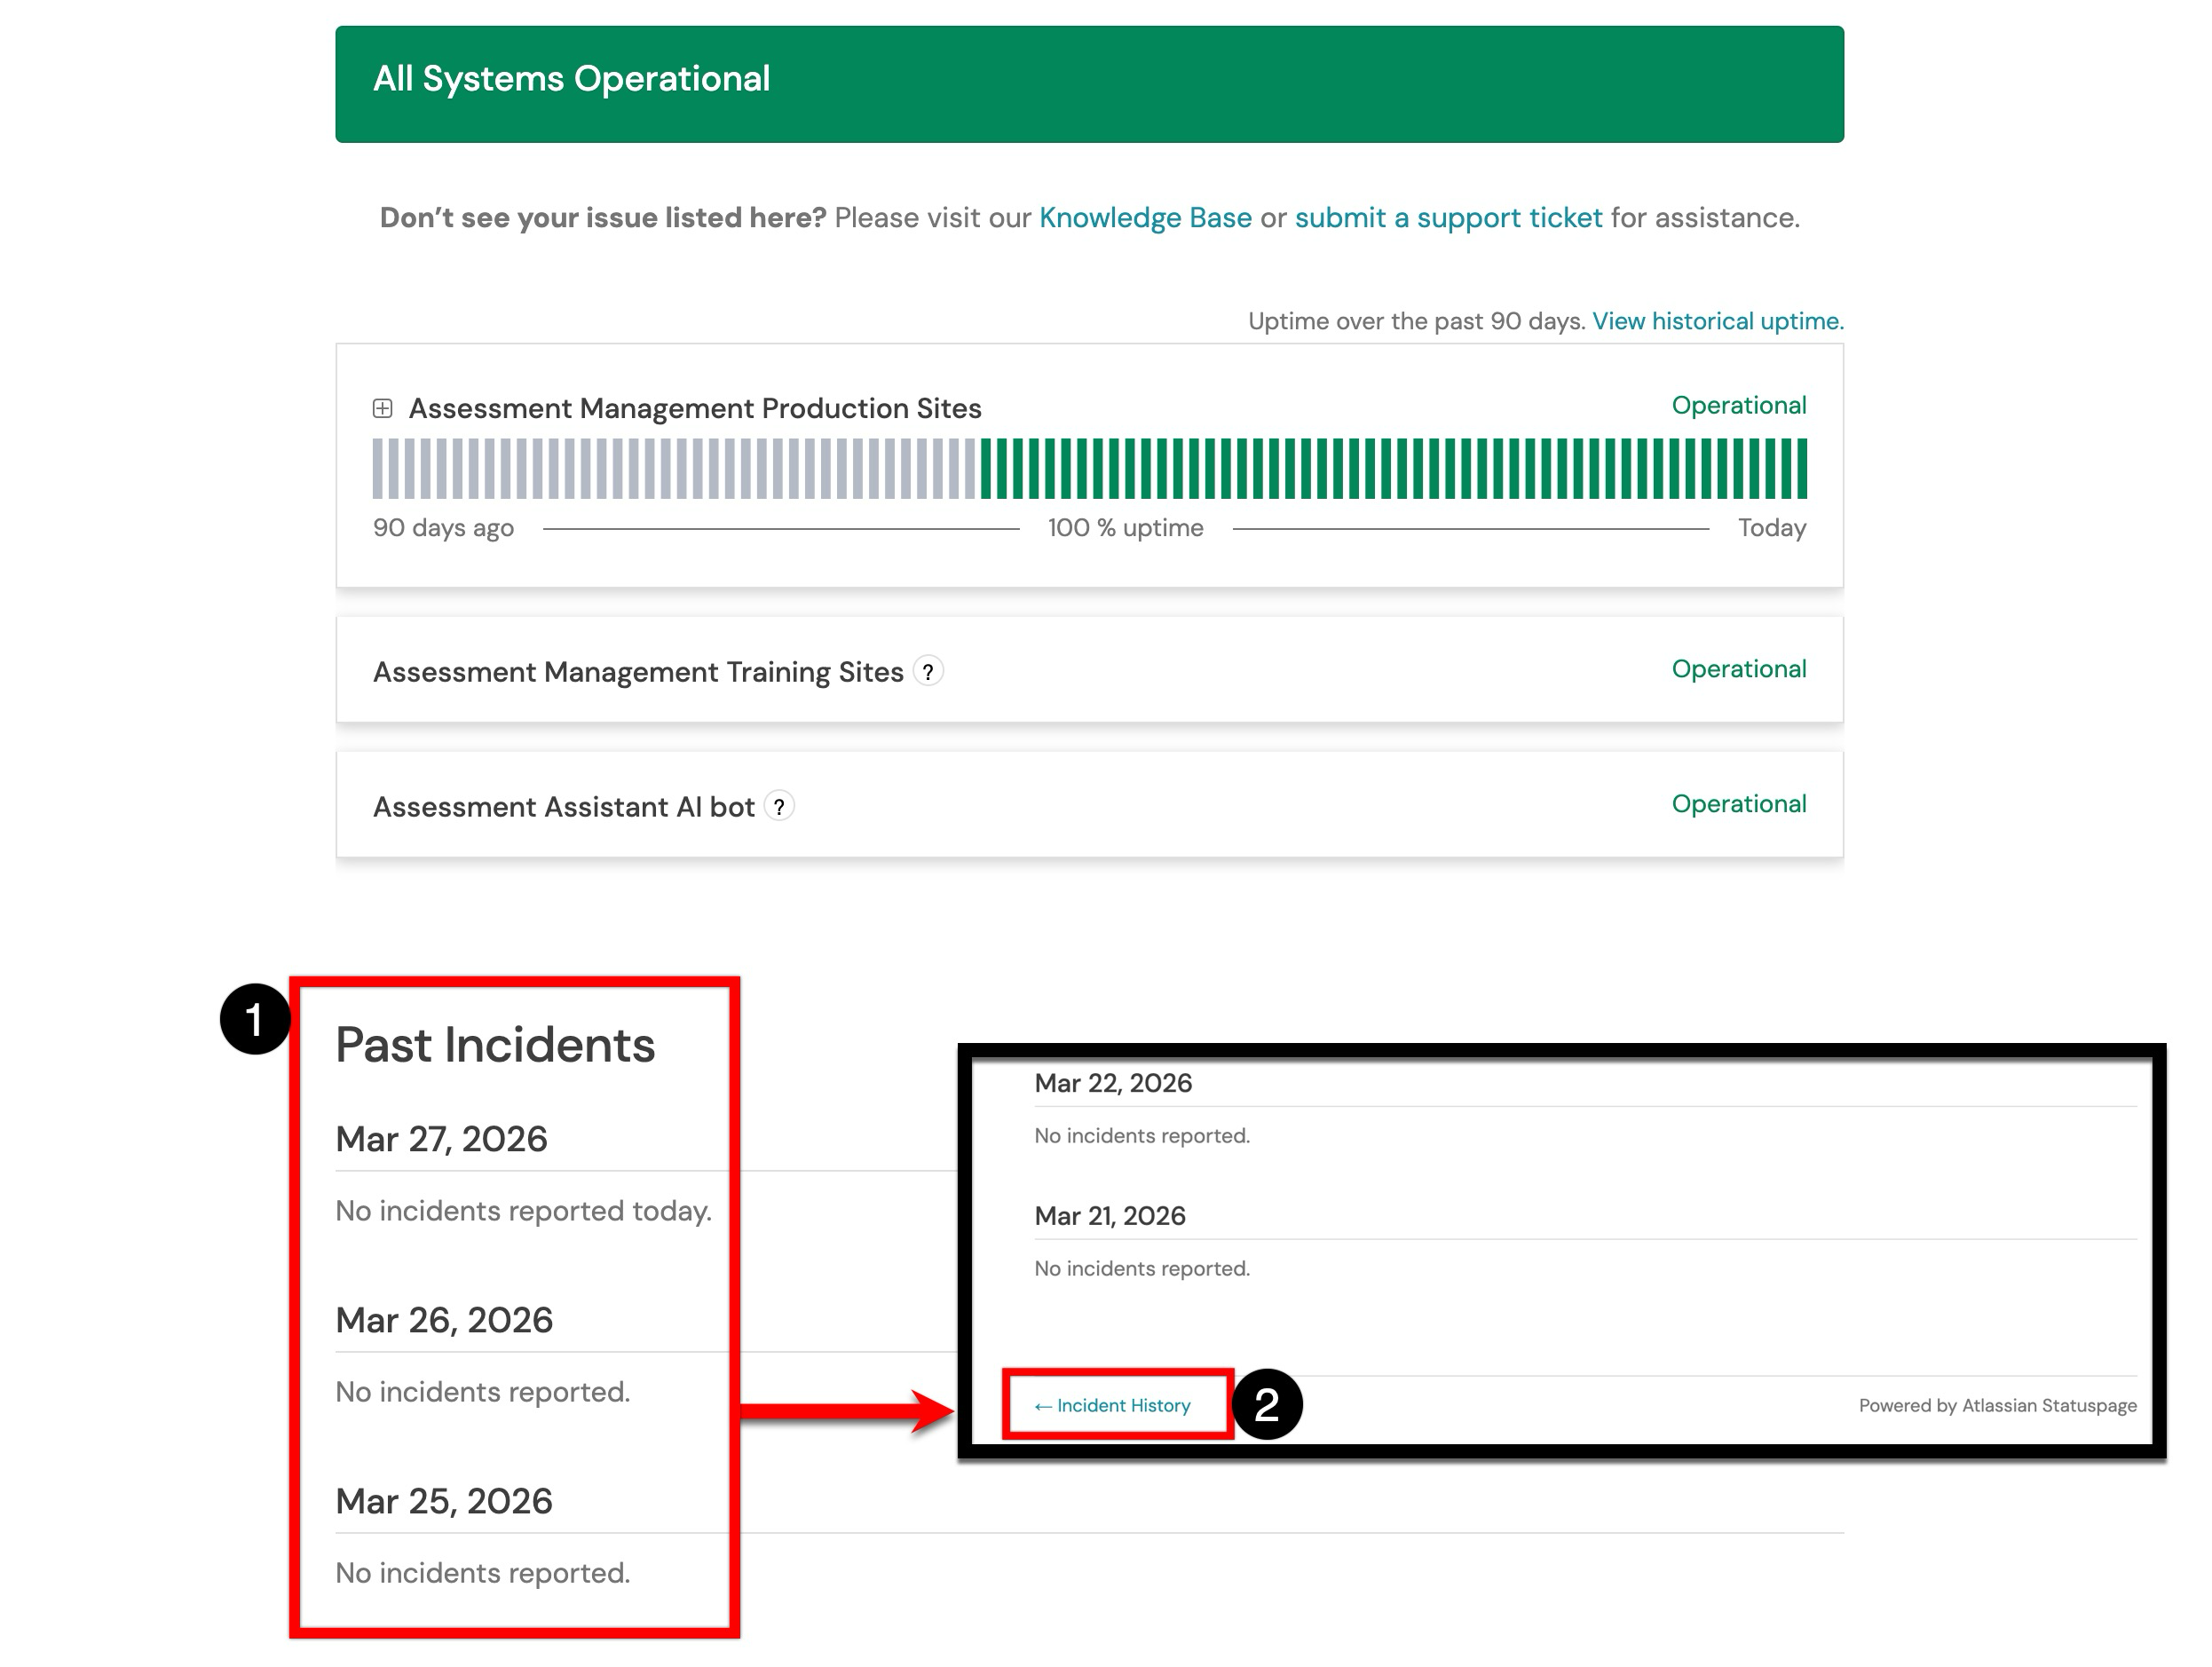
The lower section of the page lists recent incidents in reverse chronological order (1). If no incidents occurred on a given date, the entry will display No incidents reported. Select Incident History at the bottom of the page (2) to access a full historical log. Each incident entry may include:
-
Incident name and severity level
-
Affected components
-
A status timeline: Investigating → Identified → Monitoring → Resolved
-
A resolution summary
Status Indicators
|
Status |
What It Means |
|
Operational |
All systems are functioning normally. |
|
Degraded Performance |
At least one component is experiencing reduced performance. |
|
Partial Outage |
Some users or functions are impacted. |
|
Major Outage |
Widespread disruption. The system is down or severely impaired. |
|
Under Maintenance |
Planned work is in progress. Expect temporary disruption. |
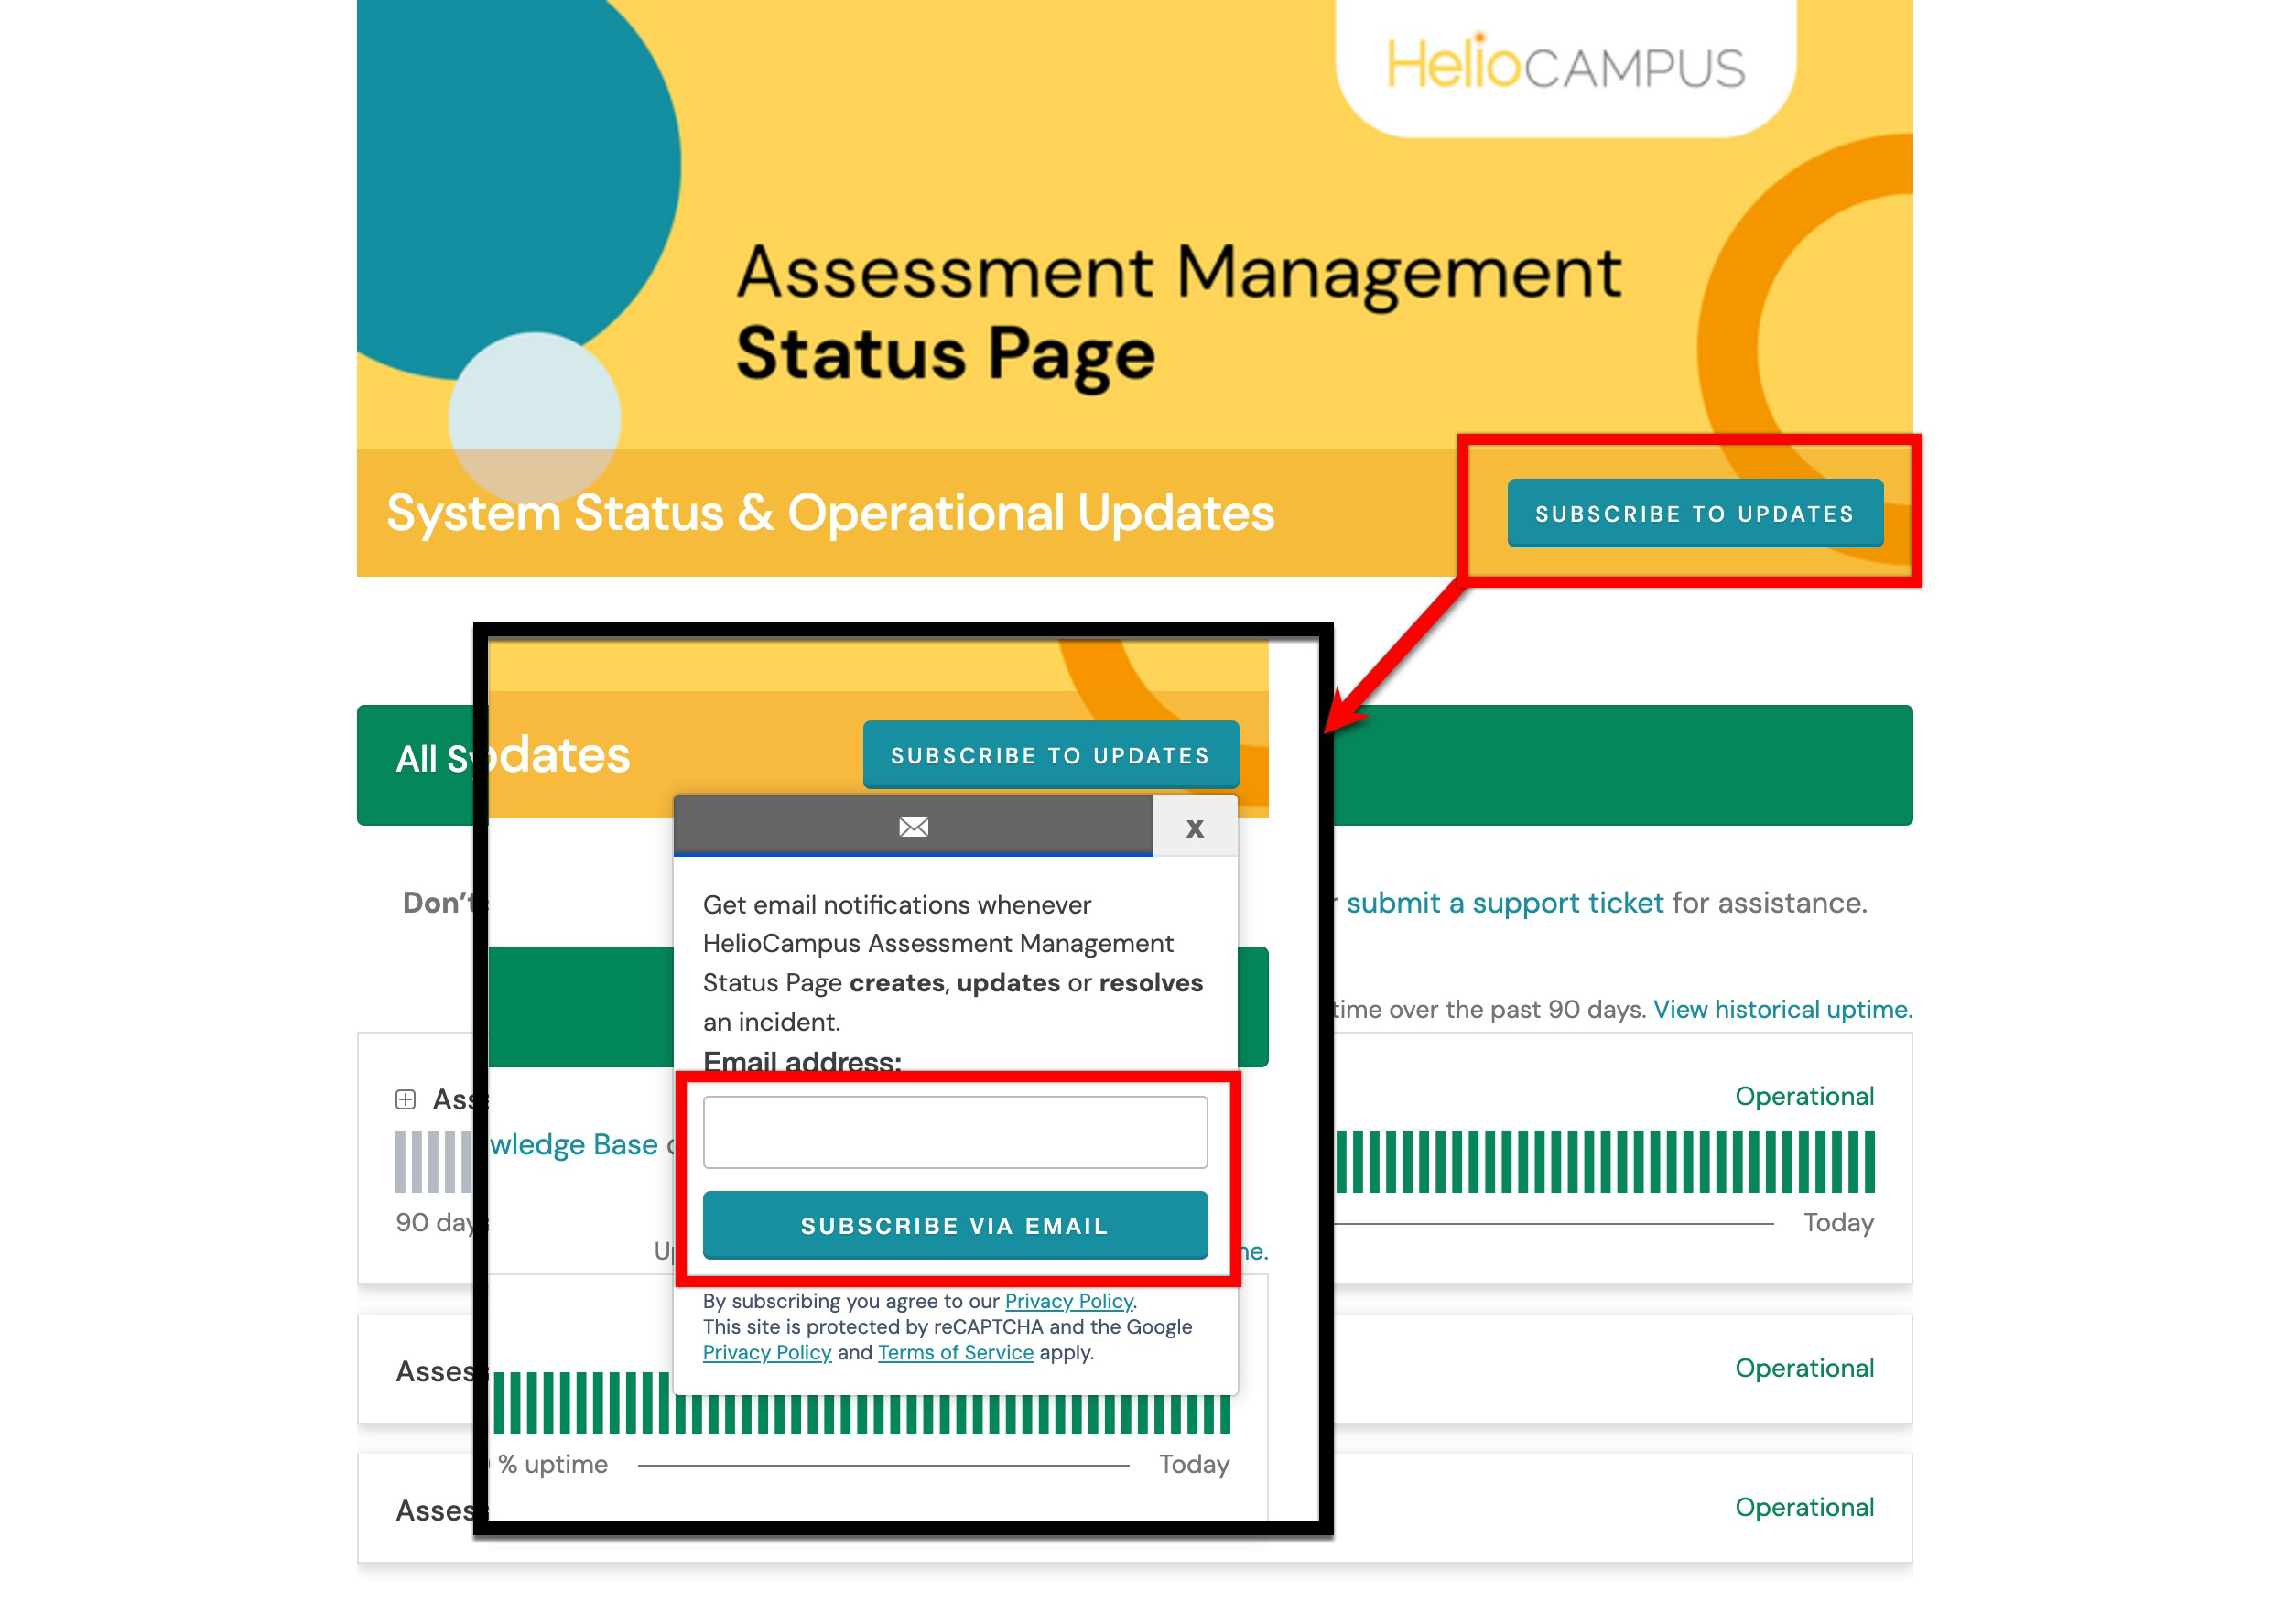
Subscribing to Notifications
Email notifications can be configured to alert users when an incident is created, updated, resolved or updated with a postmortem (only Major Outages on Production will receive postmortems). Subscribing to notifications is recommended for platform administrators and team leads who need to be promptly informed of disruptions. Select Subscribe to Updates at the top of the status page to sign up for email updates. Once subscribed, an email with a verification link will be sent to the provided address. Clicking the verification link will confirm subscription to receive notifications.