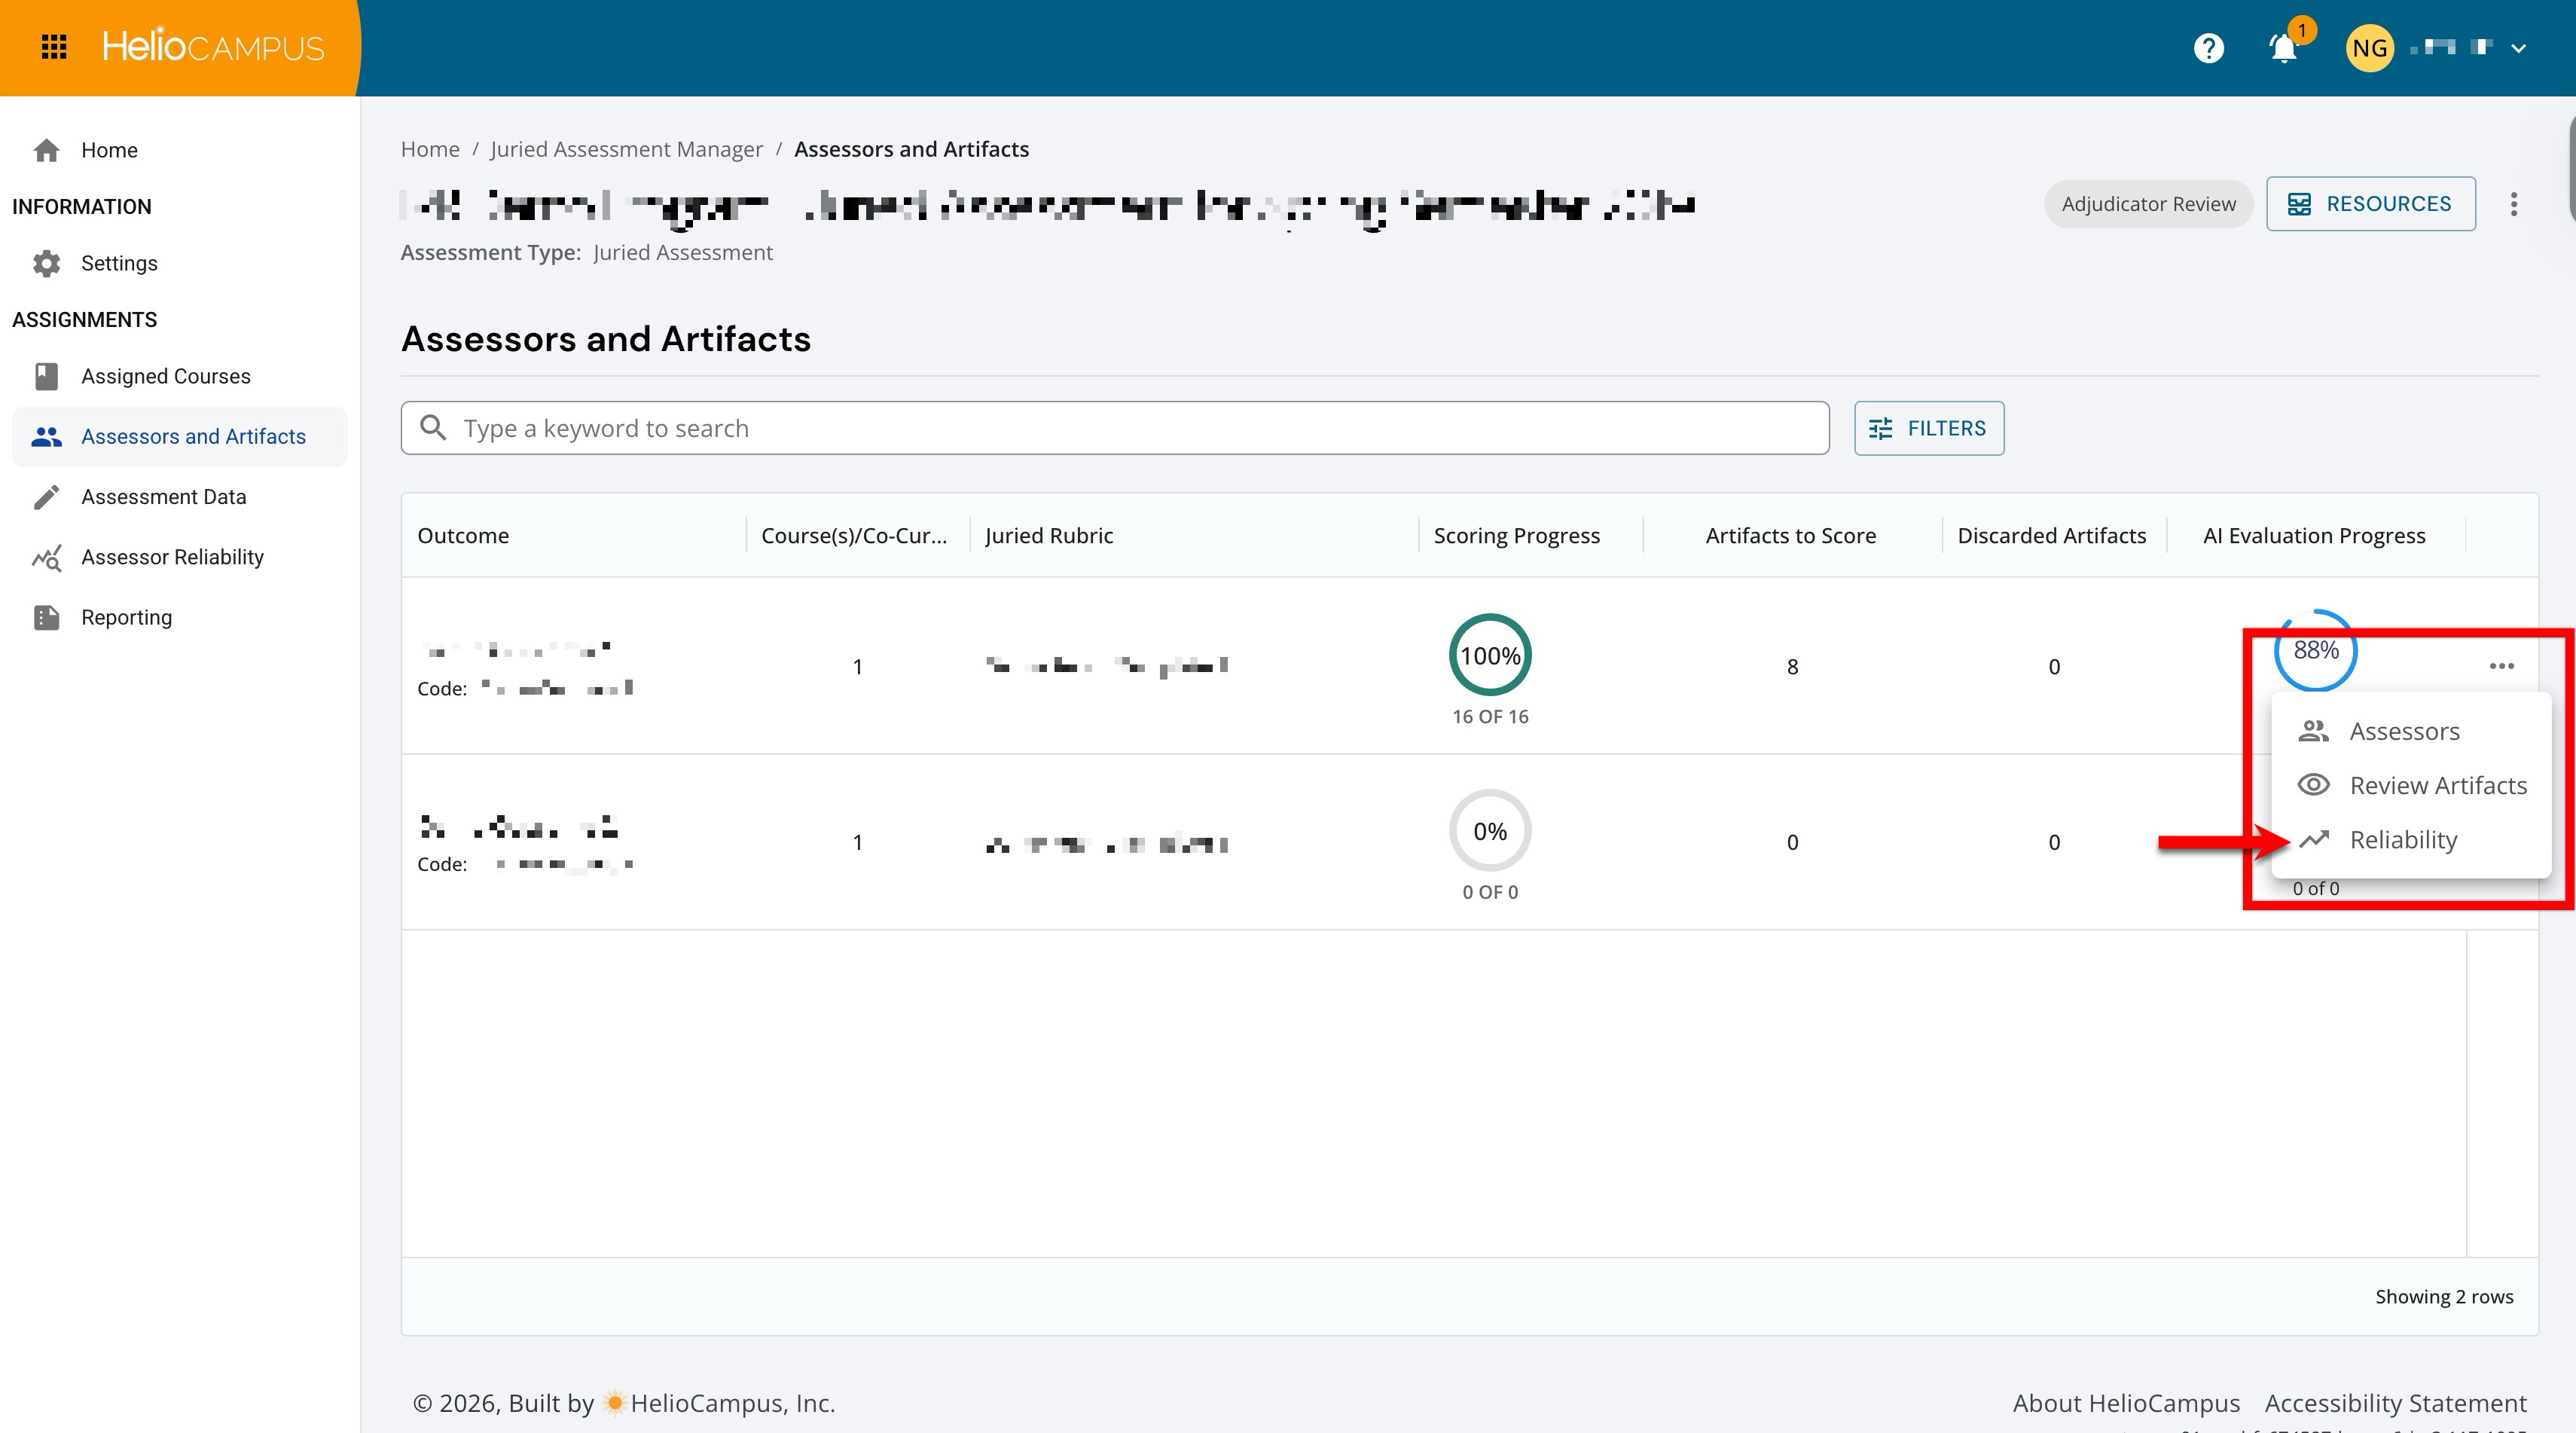
When Inter-Rater Reliability is enabled, reliability metrics can be accessed from the Assessors and Artifacts page. The Reliability page is an analytics view within a Juried Assessment. It does not create or store its own records; it reads the scores that assessors submit for outcomes' artifacts. Selecting Reliability opens a full-page view for that single outcome only.
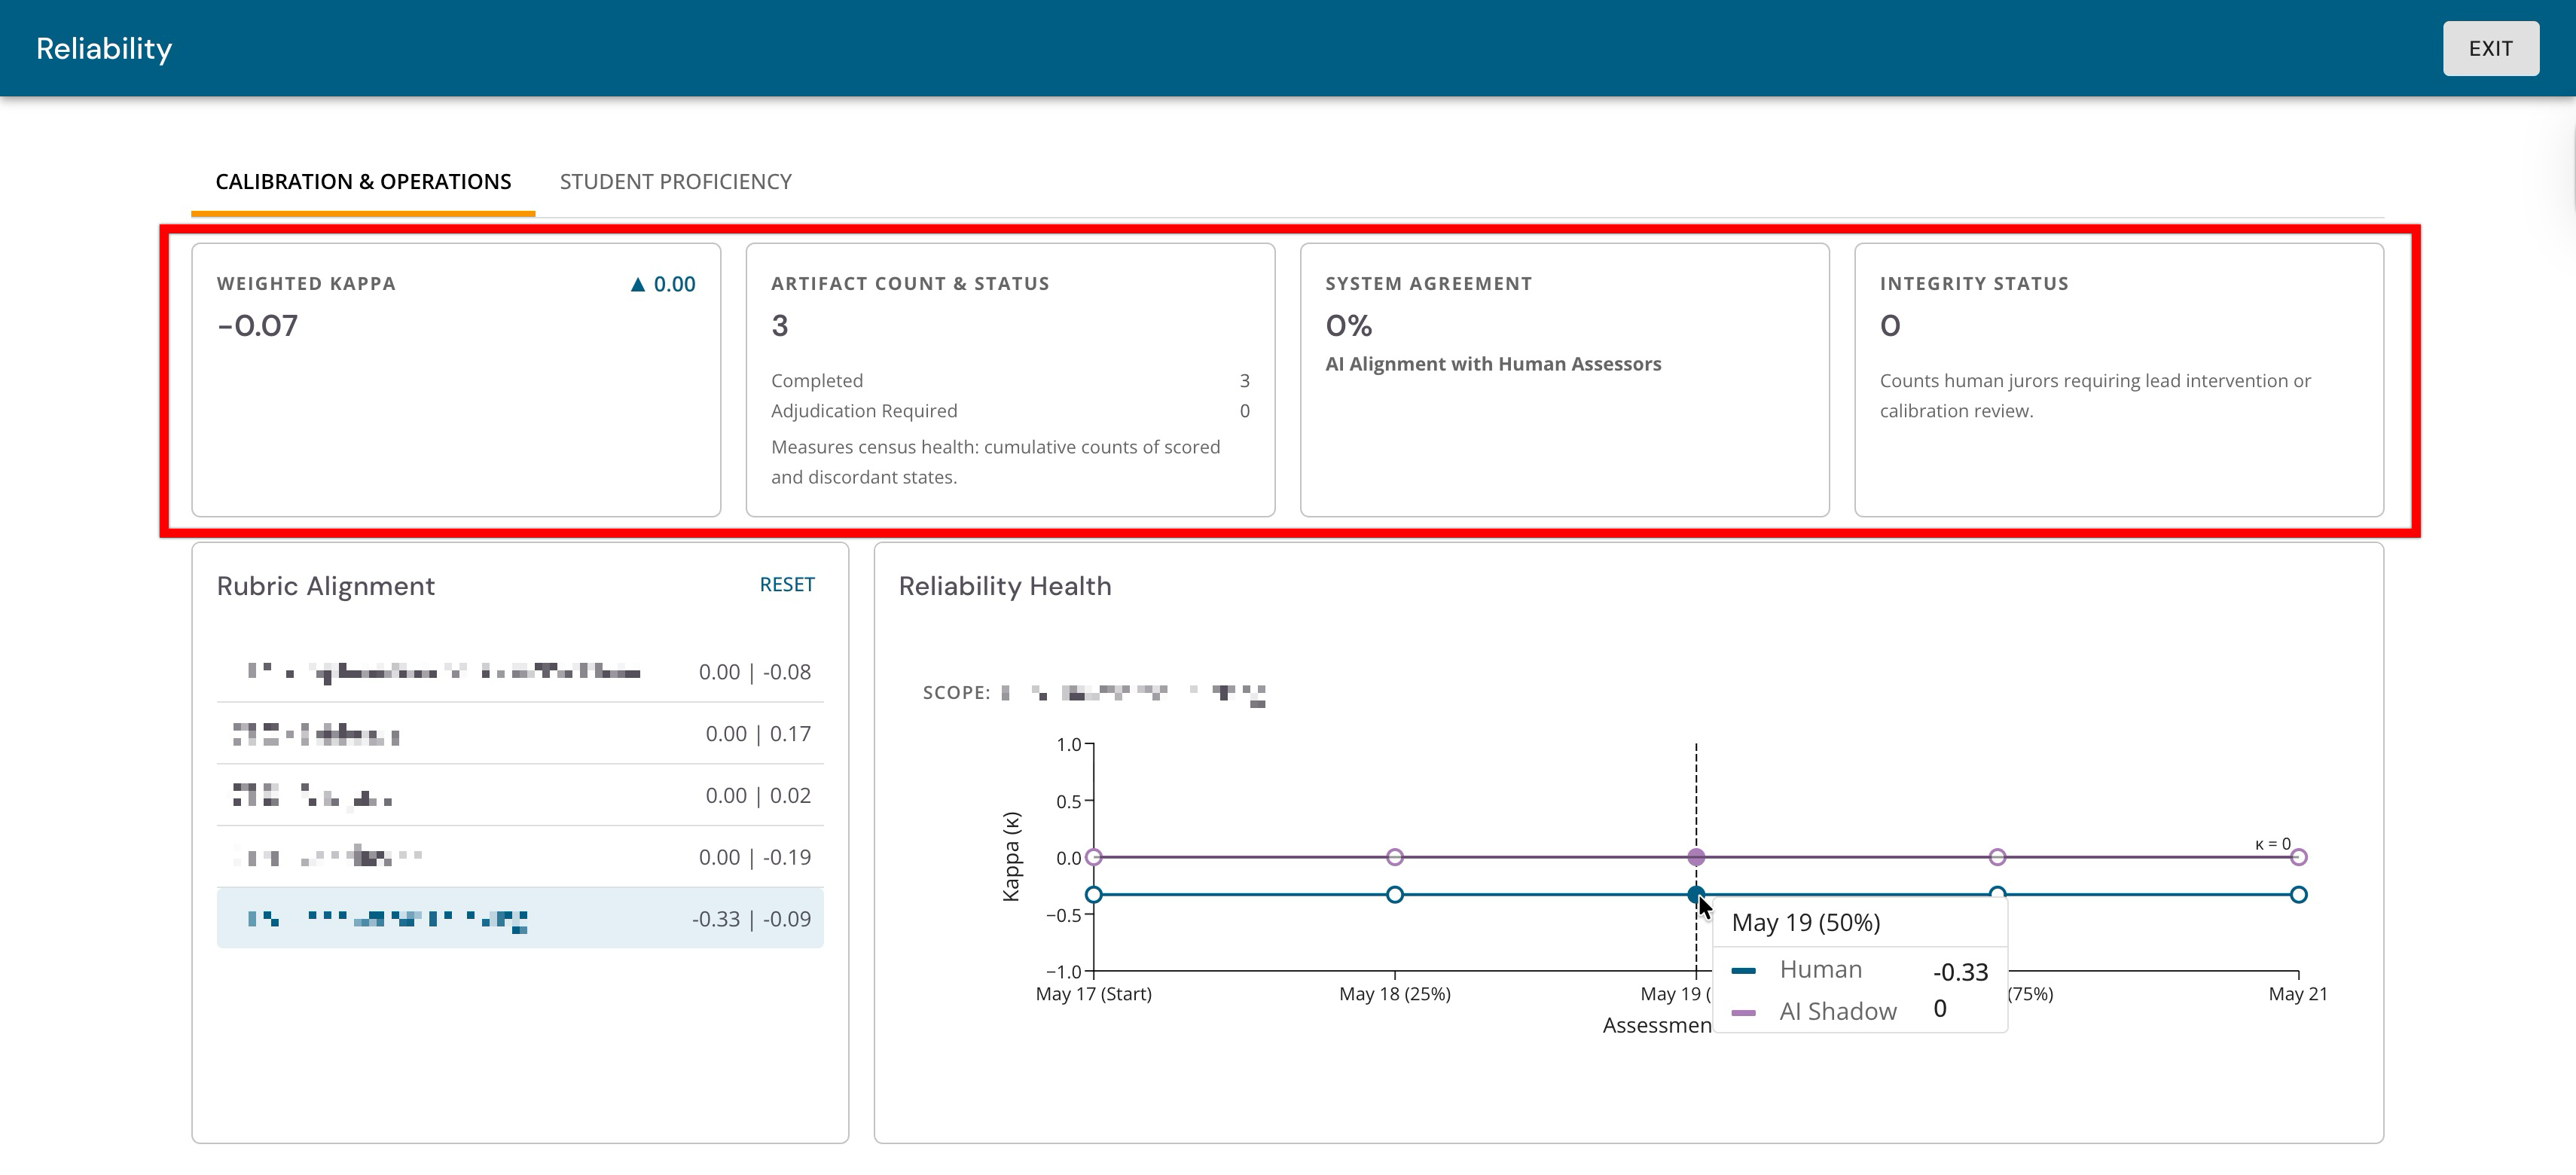
The Reliability page opens on the Calibration & Operations tab, which leads with a row of summary cards. The summary row provides an at-a-glance read on the health of the scoring effort:
-
Weighted Kappa: This displays the IRR agreement score for the outcome, shown as a κ (kappa) value with a trend indicator showing how it has changed. This is the average of the per-criterion kappa values, so it reflects the whole rubric. Kappa runs from −1 to 1; values near 1 indicate strong agreement, 0 indicates agreement, and negative values indicate disagreement.
-
Artifact Count & Status: This card measures census health: how much scoring is done and how much is in a discordant state. The number of artifacts in scope is displayed, segmented into completed and adjudication-required counts (if manual adjudication is enabled).
-
System Agreement: The percentage alignment between the AI's scores and the human assessors. This is only shown when AI Analysis is enabled.
-
Integrity Status: This displays the count of human jurors flagged as requiring lead intervention or calibration review. This data can be used to spot assessors who are out of step with the intended IRR agreement.
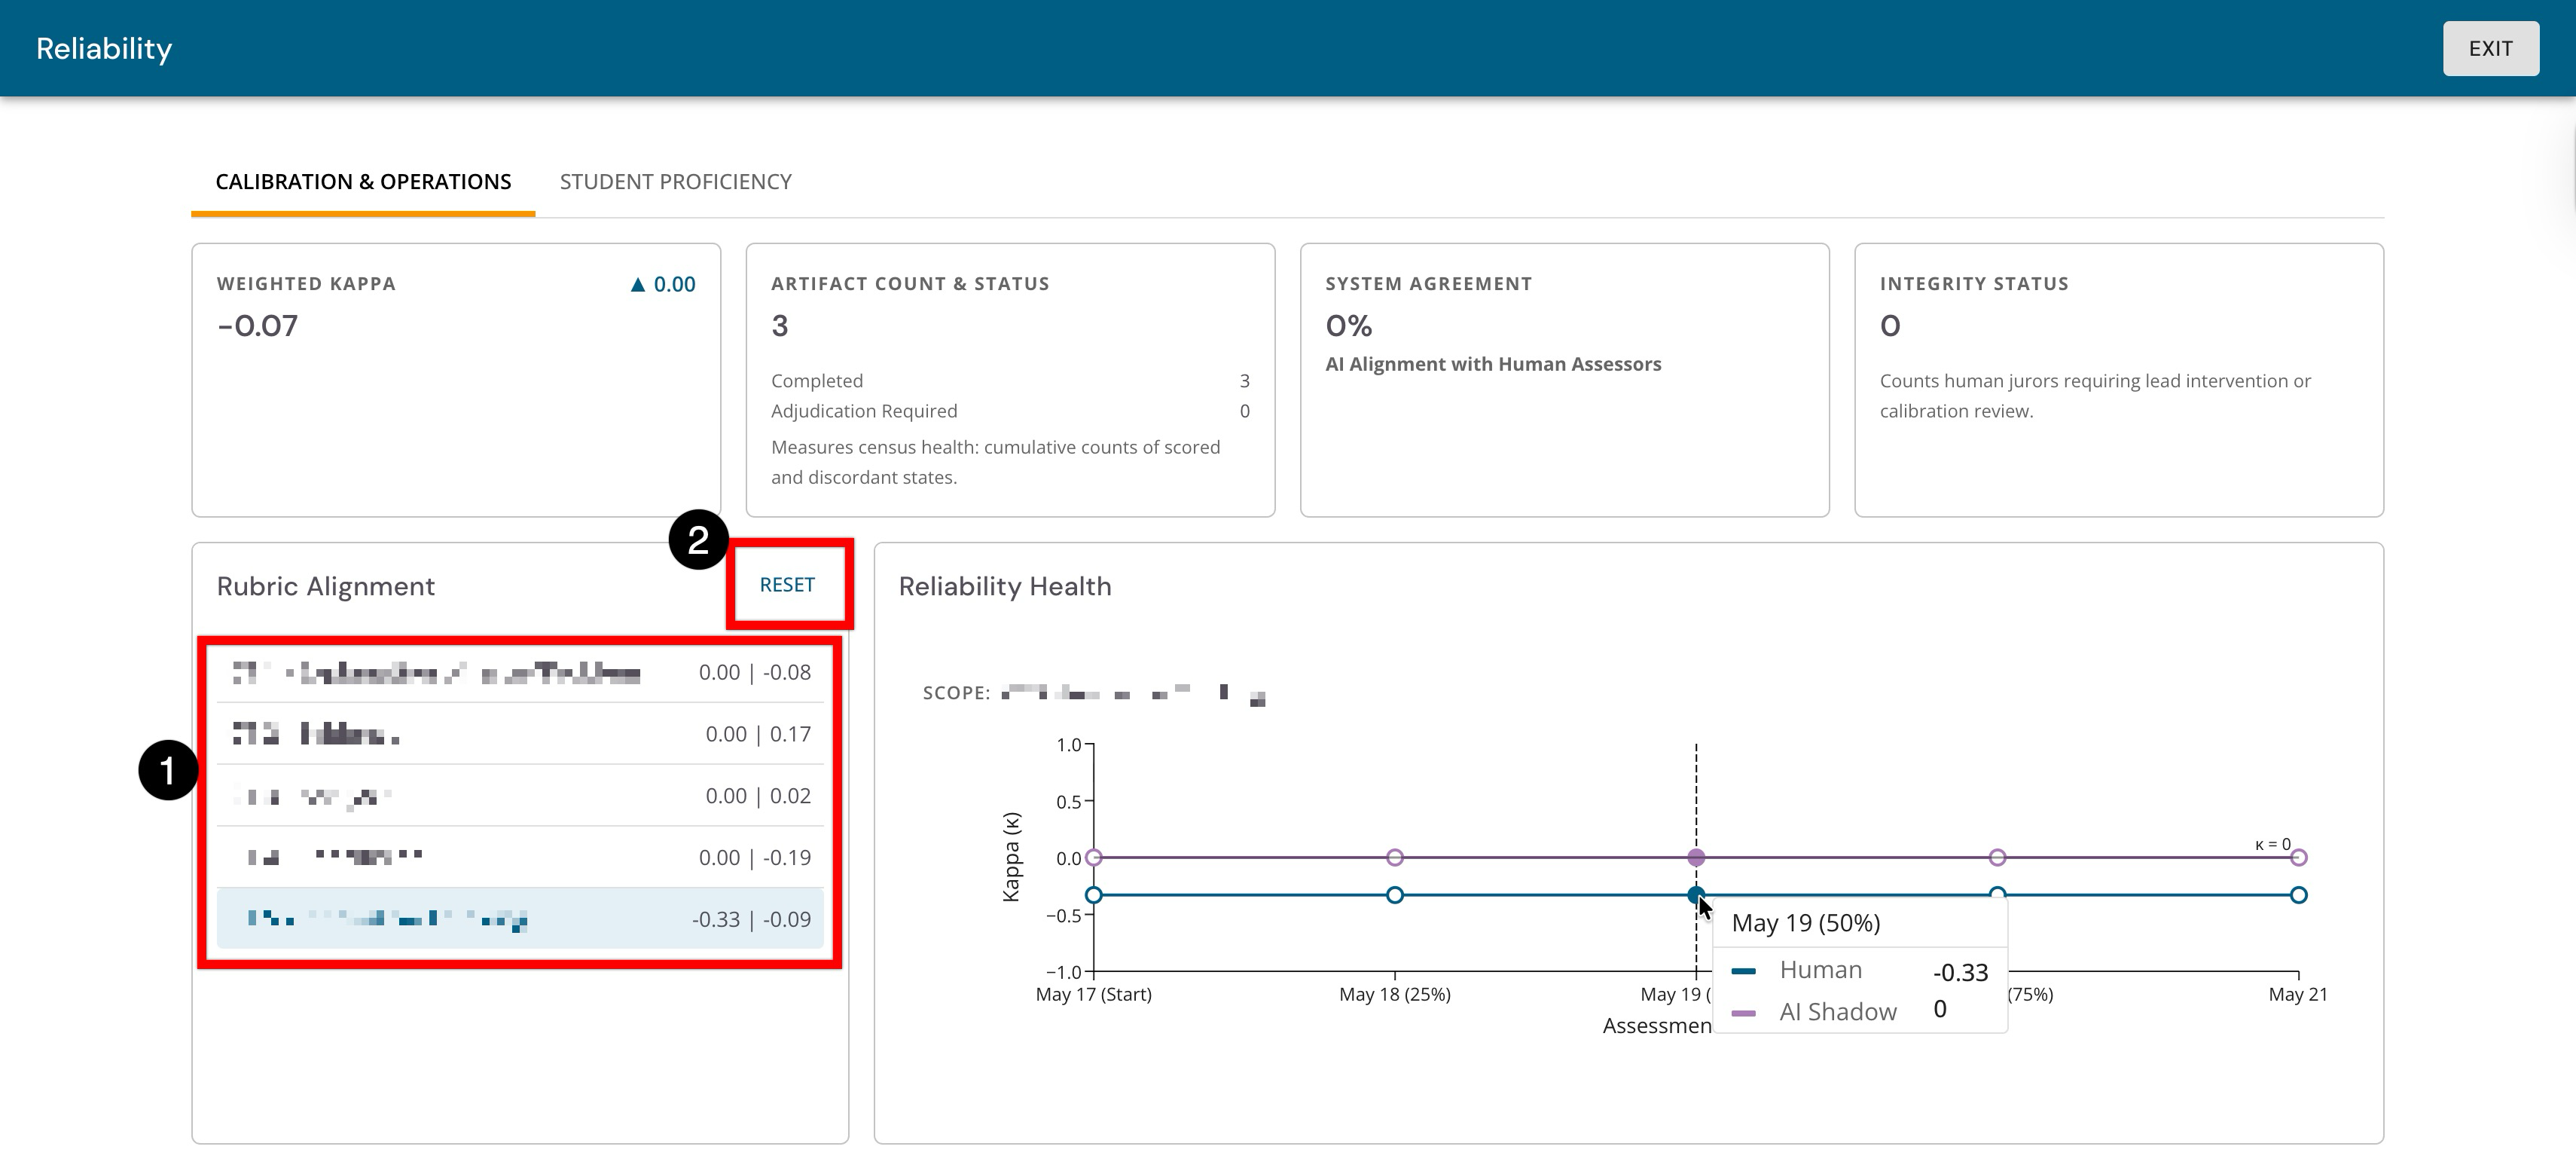
Below the summary cards, the Rubric Alignment list and the Reliability Health chart work together. The Rubric Alignment section lists each rubric criterion along with its weighted kappa value (1). A criterion with a low κ is where assessors interpret the standard differently, and it is the natural target for calibration. Clicking Reset (2) refreshes the chart's focus to the first criterion in the list after other criteria have been reviewed.
When AI Analysis is enabled, each row shows two values in the form Human | AI (for example,
0.00 | -0.08).
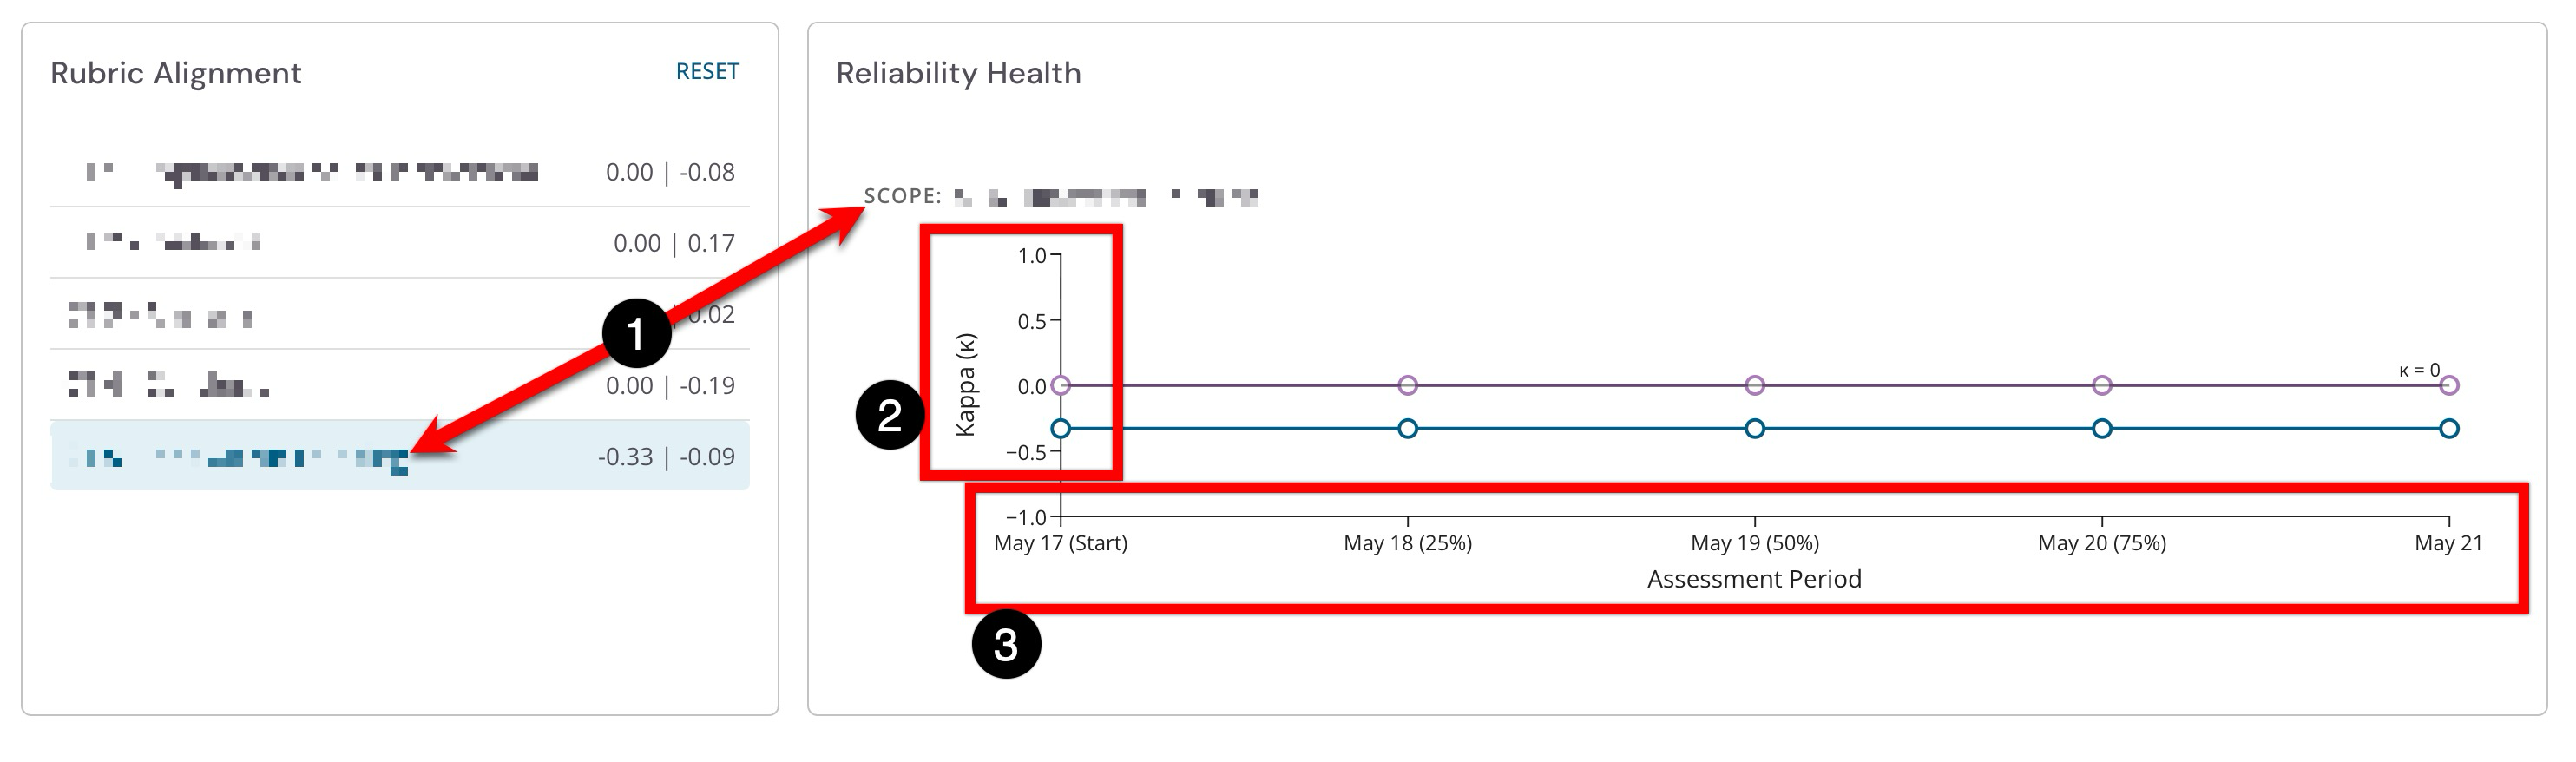
Selecting a criterion focuses the chart on that criterion; it plots agreement across the scoring window. Clicking a row in Rubric Alignment highlights it and scopes the chart to that criterion (1). The scope above the chart names the criterion currently in focus (2). Hovering over a point on the charted line shows that period's values (3): the date and percentage through the window, the Human kappa, and the AI Shadow kappa (when enabled).
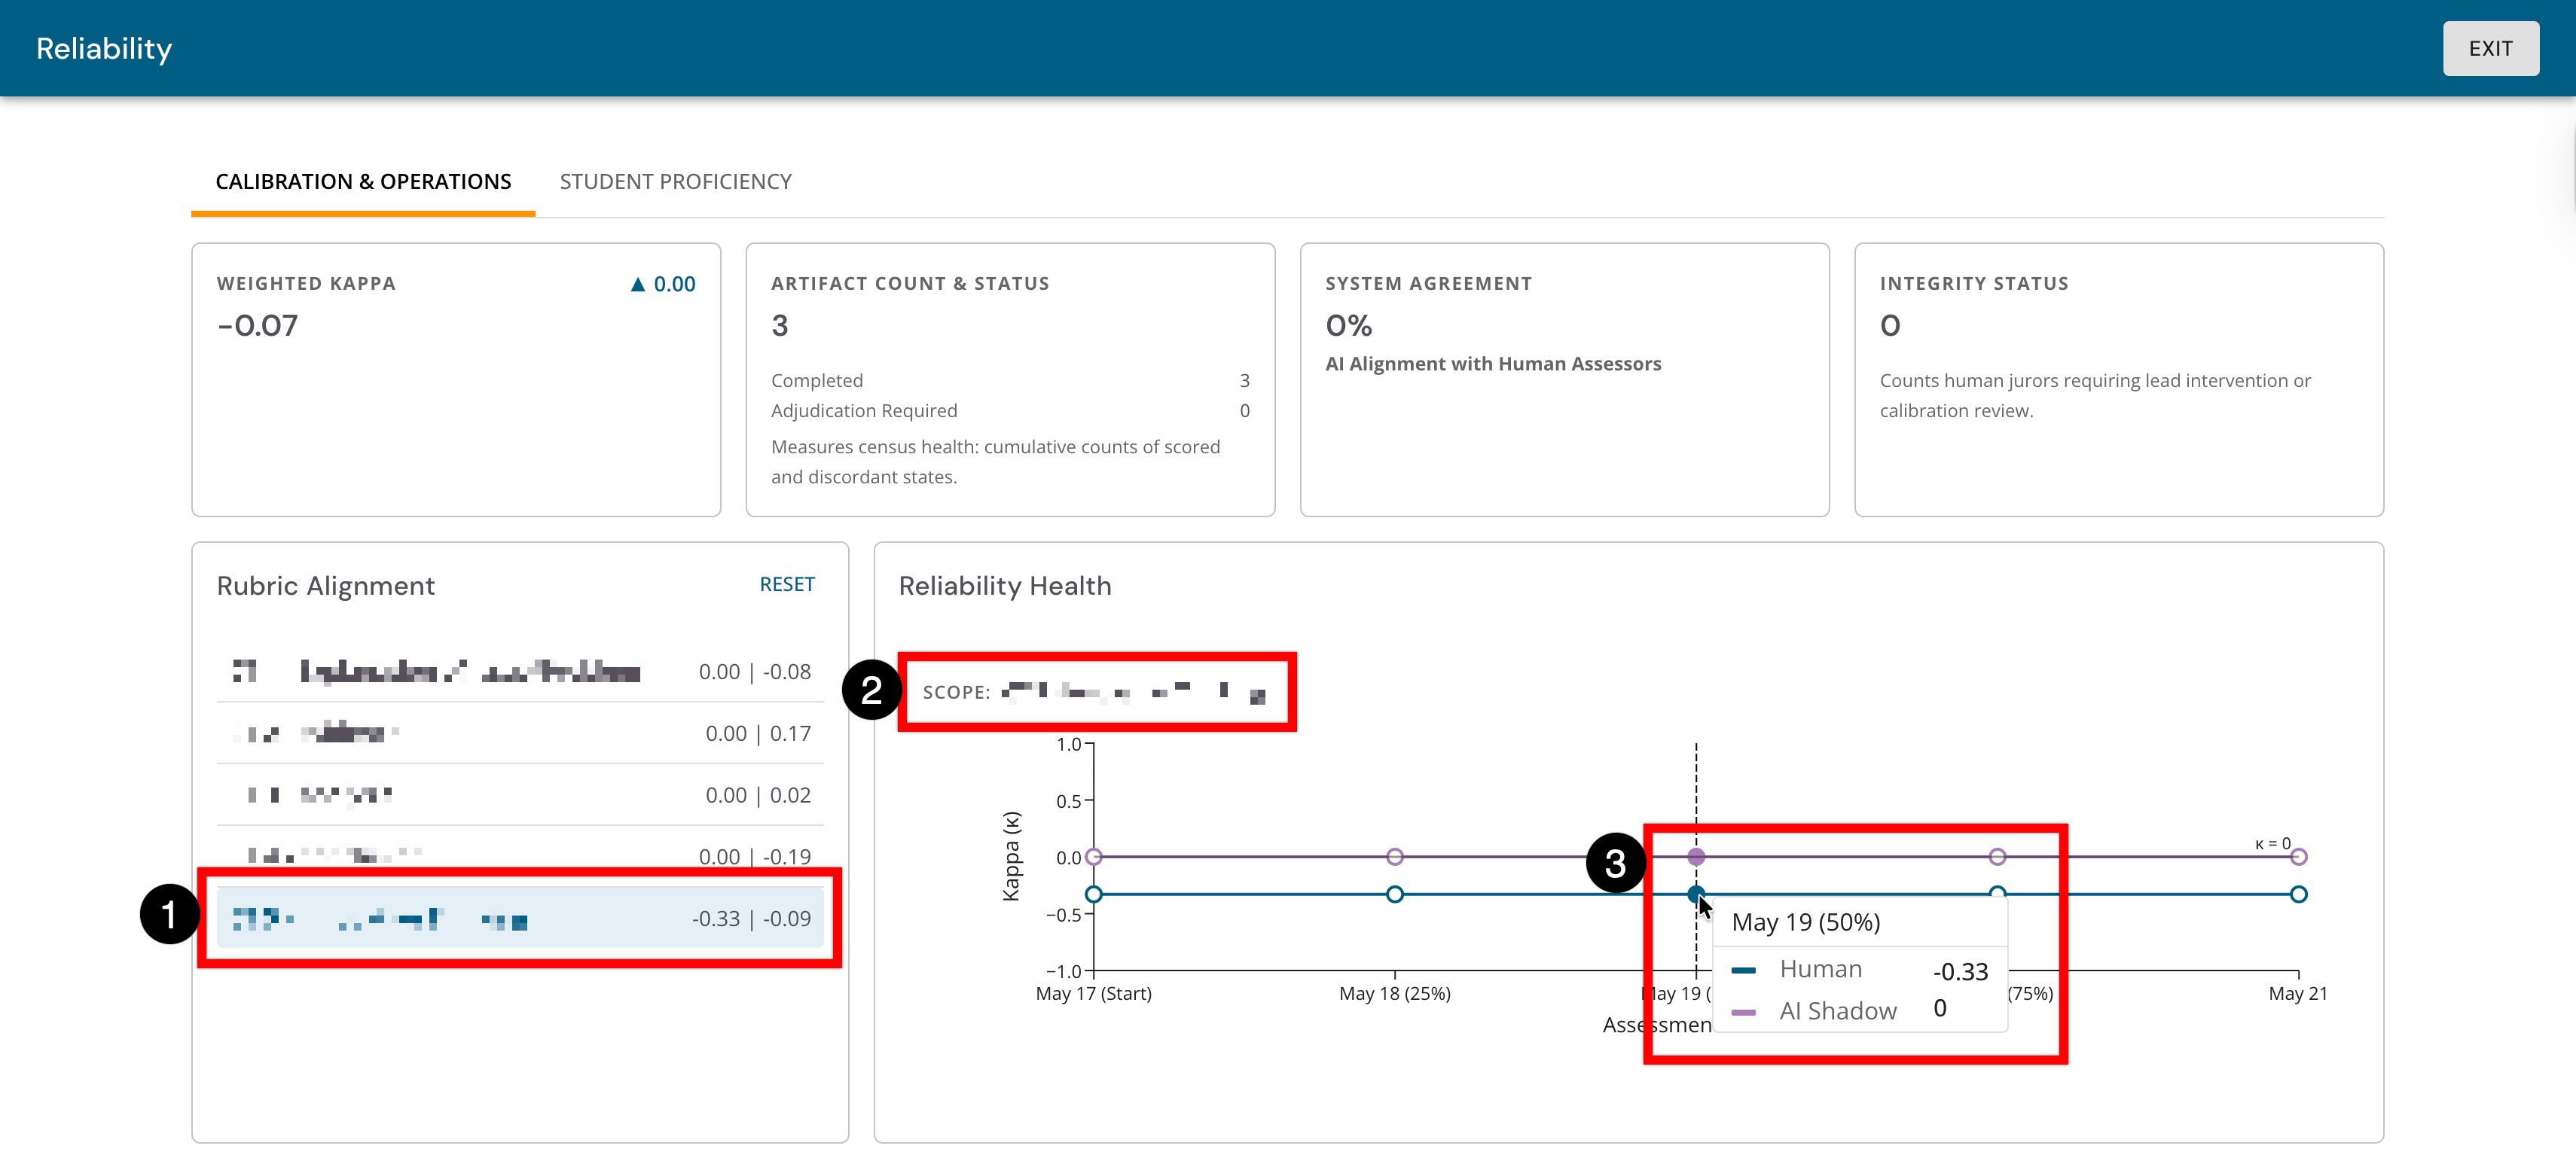
The highlighted criterion in Rubric Alignment drives what the chart displays (1). The vertical axis is Kappa (κ) on a fixed −1 to 1 scale, with a reference line at κ = 0 marking chance agreement (2). Points above the line indicate agreement better than chance; points below indicate worse. The horizontal axis runs across the scoring window from start (0%) to end, labeled with dates and progress percentages (3). Because the trend is cumulative, it’s expected to see agreement improve as scoring progresses (the expected pattern) or to drift. When AI Analysis is enabled, a second AI Shadow line is overlaid for comparison.